


NZD/USD Price Forecast: Drifting closer to 18-month lows at 0.5580
- NZD/USD turns lower from a 0.5622 high on Wednesday and approaches an 18-month low at 0.5580.
- High Oil prices amid the escalating tensions in the Middle East have hammered risk appetite on Thursday.
- The pair is trading at the bottom of the recent range, ready to extend the downtrend from August's highs.
The New Zealand Dollar (NZD) reverses earlier gains as market sentiment sours on Thursday's early European session, and turns negative against the US Dollar (USD) in the daily chart. Higher Oil prices amid escalating tensions in the Middle East are pushing Treasury yields higher and setting a floor on the US Dollar's pullback seen during the Asian trade.
New attacks on Saudi Arabian airports by the Houthis from Yemen, an Iran proxy, have boosted Oil prices, pushing the Brent Crude barrel to levels near $102.00, amid growing concerns about supply constraints if new attacks damage Saudi's Oil sites.
Crude's rally is also boosting Treasury yields amid markets’ conviction that the elevated energy prices will force central bankers to tighten monetary policy. This has offset the mild US Dollar weakness witnessed after the release of September’s Federal Reserve (Fed) meeting, which showed concerns about inflation but did not alter the view that the central bank will stand pat on rates in October.
Technical Analysis: Support at 0.5580 is coming into play
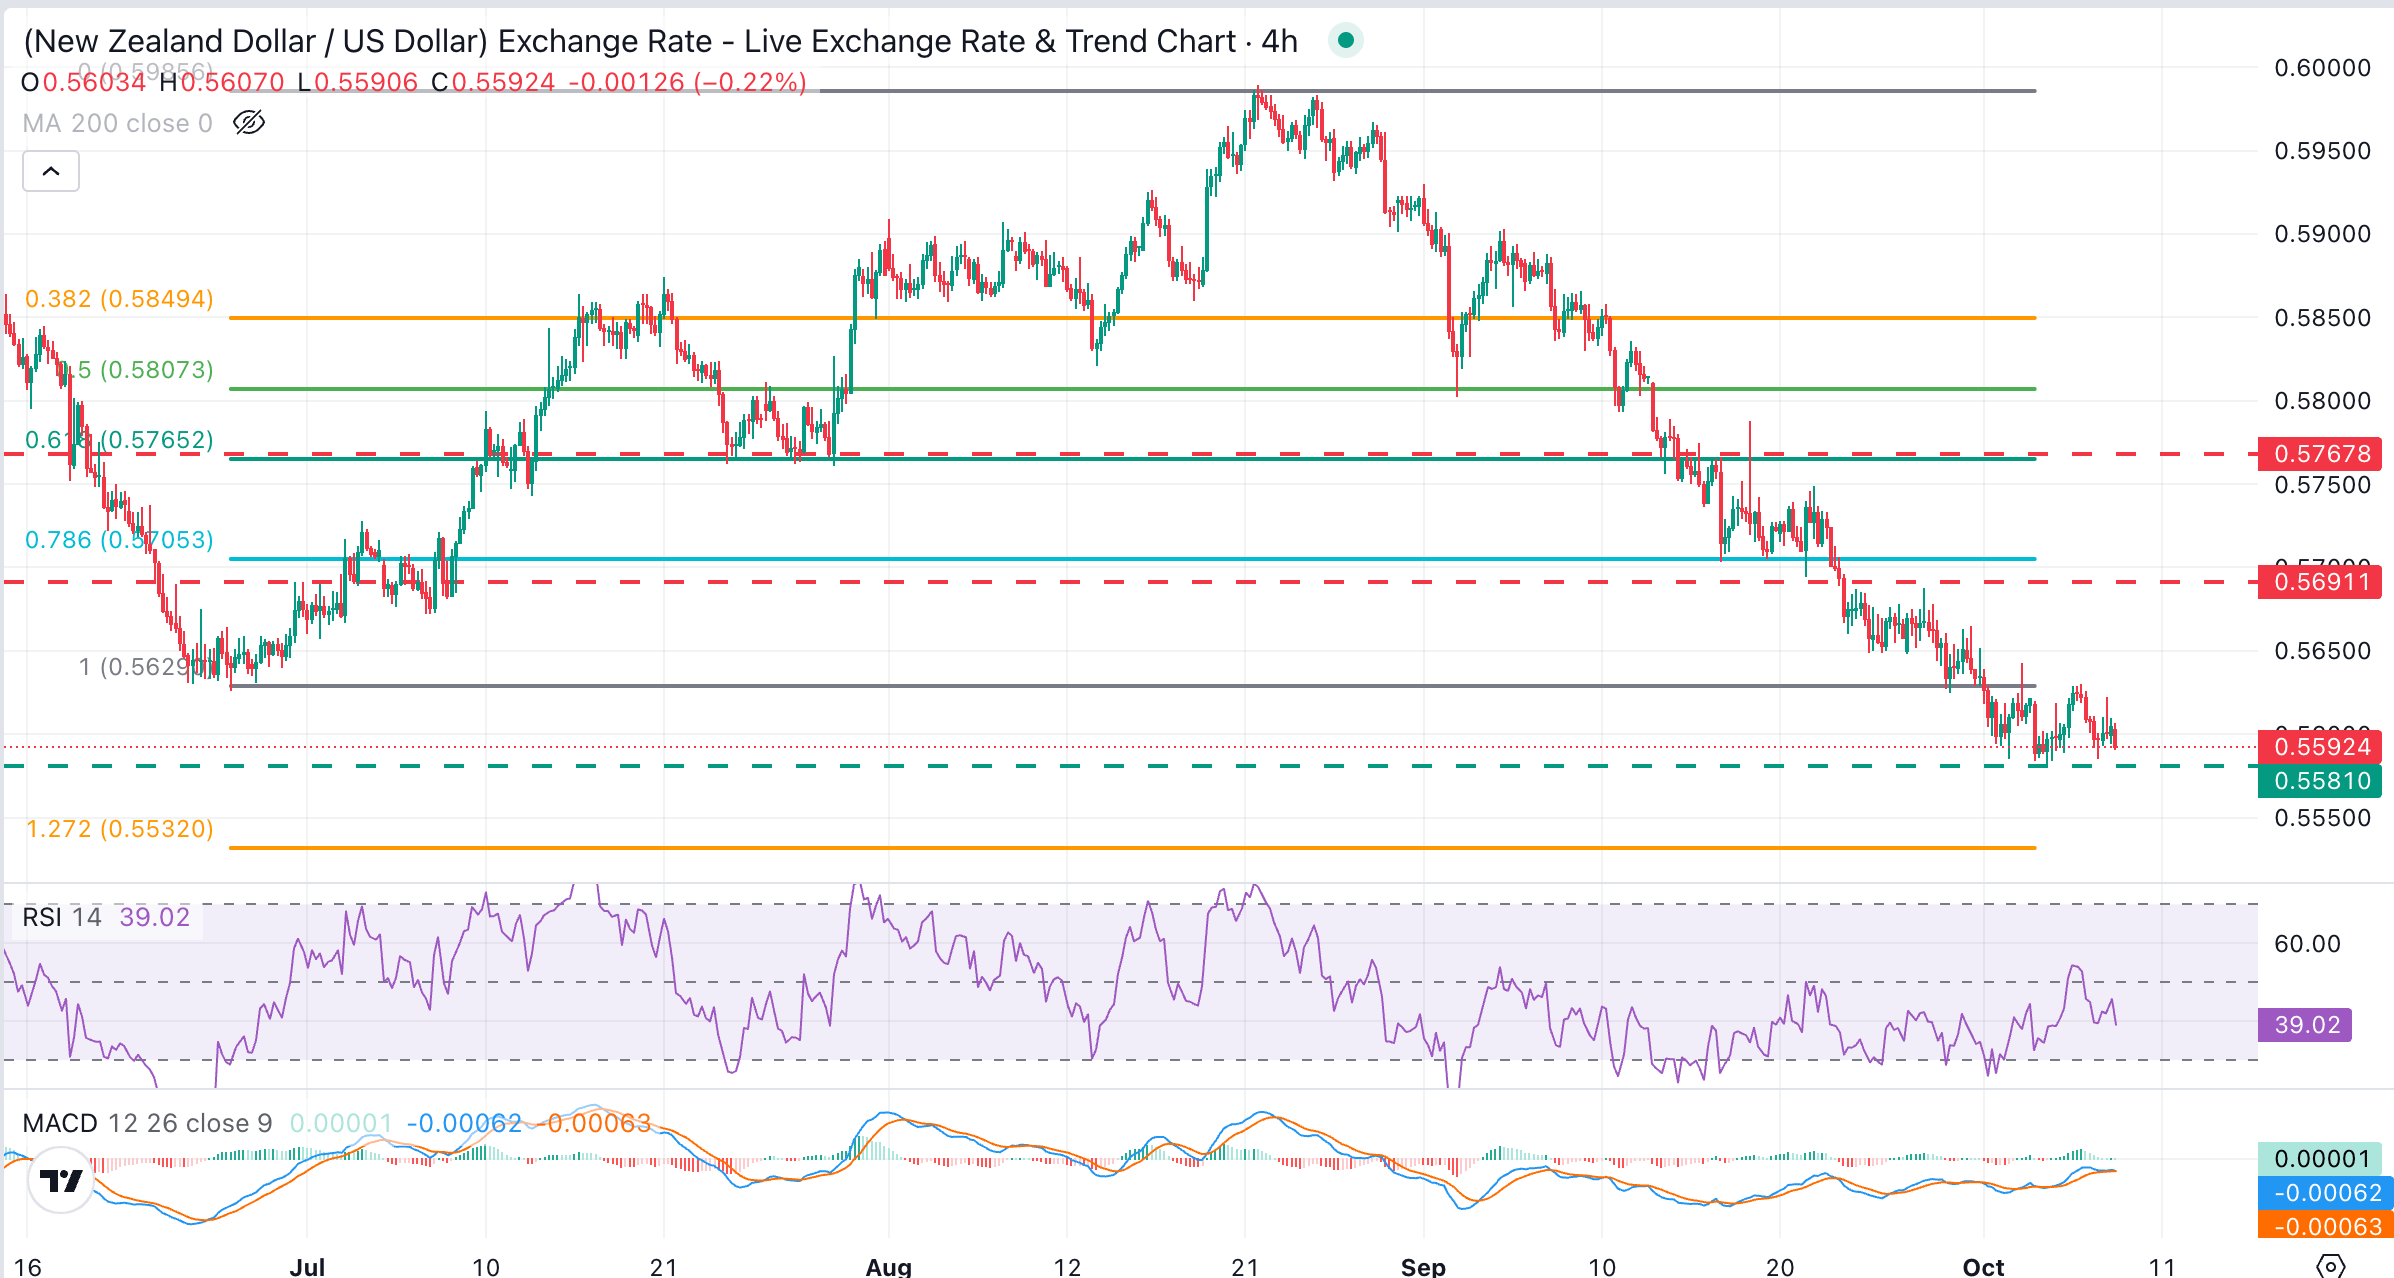
NZD/USD trades at 0.5596, with bearish momentum building as the 0.5580 support area comes into focus. Indicators on the 4-hour chart endorse this view, with the Relative Strength Index (14) around 40 and the Moving Average Convergence Divergence (MACD) hovering near zero, altogether leaving the bears with a slight edge.
Bears are focused on Monday's low at the mentioned 0.5580. Below here, the next downside target would be the 127.2% Fibonacci retracement of the June-August rally, at 0.5530, ahead of the 2025 floor, at 0.8490.
On the topside, the late June low in the 0.5630 area is keeping upside attempts capped for now, and closing the path towards the September 28 high near 0.5690 and a support-turned-resistance around the June 23 lows at 0.5765.
(The technical analysis of this story was written with the help of an AI tool. Know more.)
New Zealand Dollar Price Today
The table below shows the percentage change of New Zealand Dollar (NZD) against listed major currencies today. New Zealand Dollar was the strongest against the Australian Dollar.
| USD | EUR | GBP | JPY | CAD | AUD | NZD | CHF | |
|---|---|---|---|---|---|---|---|---|
| USD | 0.04% | 0.10% | 0.06% | -0.01% | 0.26% | 0.11% | -0.03% | |
| EUR | -0.04% | 0.06% | 0.02% | -0.06% | 0.15% | 0.08% | -0.07% | |
| GBP | -0.10% | -0.06% | -0.04% | -0.13% | 0.08% | 0.02% | -0.11% | |
| JPY | -0.06% | -0.02% | 0.04% | -0.09% | 0.13% | 0.02% | -0.07% | |
| CAD | 0.01% | 0.06% | 0.13% | 0.09% | 0.22% | 0.13% | 0.02% | |
| AUD | -0.26% | -0.15% | -0.08% | -0.13% | -0.22% | -0.06% | -0.20% | |
| NZD | -0.11% | -0.08% | -0.02% | -0.02% | -0.13% | 0.06% | -0.08% | |
| CHF | 0.03% | 0.07% | 0.11% | 0.07% | -0.02% | 0.20% | 0.08% |
The heat map shows percentage changes of major currencies against each other. The base currency is picked from the left column, while the quote currency is picked from the top row. For example, if you pick the New Zealand Dollar from the left column and move along the horizontal line to the US Dollar, the percentage change displayed in the box will represent NZD (base)/USD (quote).
Recommended Articles


