


USD/JPY Price Forecast: Hammer teases rebound after 650-pip slide
- USD/JPY rebounds from seven-month low as hammer pattern emerges.
- Daily close above 154.42 opens path toward 155.00.
- Break below 153.00 exposes January yearly low at 152.10.
The USD/JPY continued to fall for the second straight day, losing 0.40%, but found support around 153.00, with the pair set to end the session at around 153.75.
USD/JPY Price Forecast: Technical Outlook
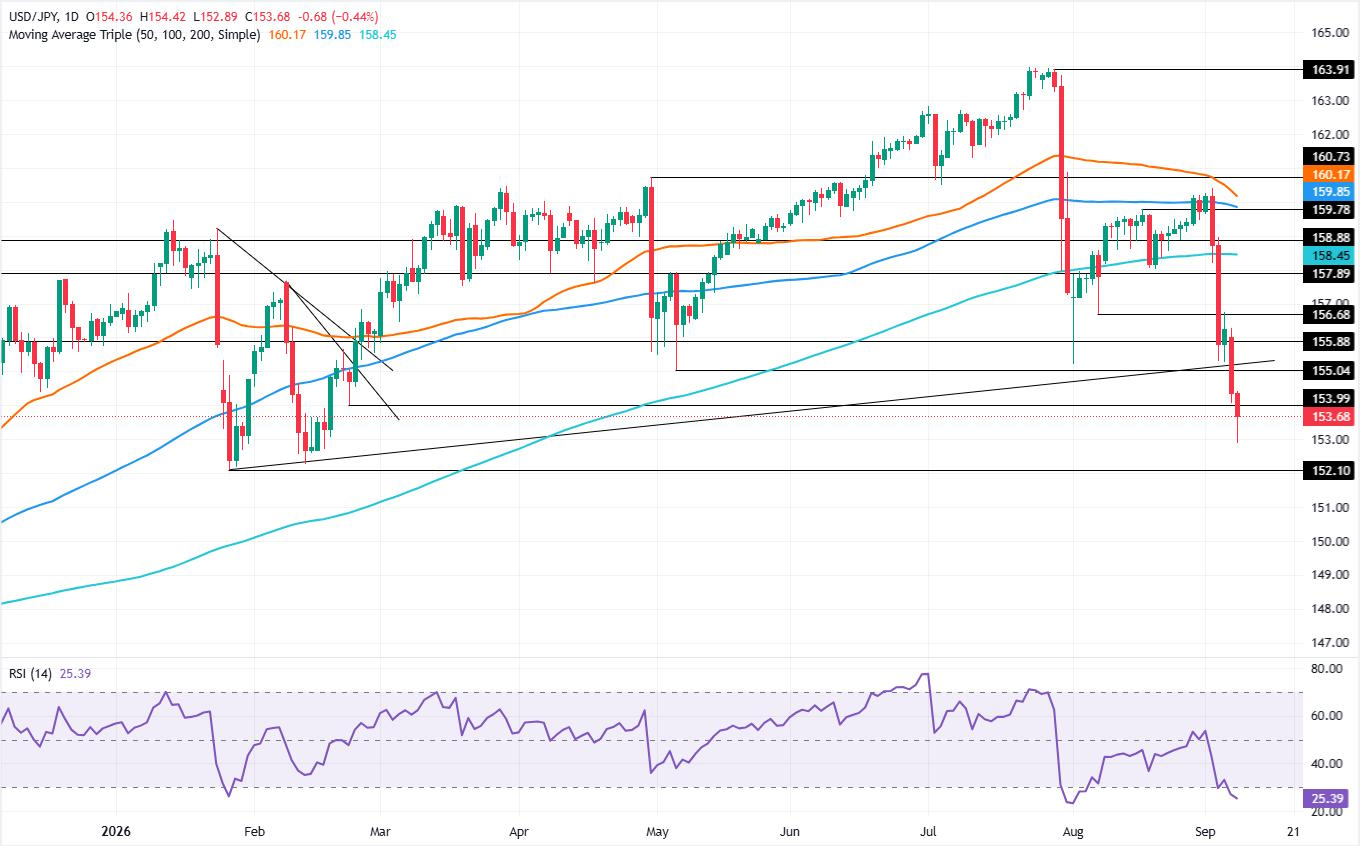
Since September 2, USD/JPY has fallen over 4% (650 pips) and even hit a nearly seven-month low of 152.89 before reclaiming the 153.70 mark, which appears to be a hammer formation. This candlestick is usually bullish, but a daily close above the high of the day (HOD) of 154.42 is needed before challenging higher prices.
In that case, the 155.00 milestone will be next, followed by the 200-day Simple Moving Average (SMA) at 158.45. Up next is 160.00.
The Relative Strength Index (RSI) is oversold, but given the velocity of the move, USD/JPY could fall further. However, if the RSI pierces above the 30 level, the pair could regain some ground.
On the other hand, if bears stepped in and cleared 153.00, they could test the yearly low of 152.10 hit on January 27.
USD/JPY Price Chart – Daily
Japanese Yen FAQs
The Japanese Yen (JPY) is one of the world’s most traded currencies. Its value is broadly determined by the performance of the Japanese economy, but more specifically by the Bank of Japan’s policy, the differential between Japanese and US bond yields, or risk sentiment among traders, among other factors.
One of the Bank of Japan’s mandates is currency control, so its moves are key for the Yen. The BoJ has directly intervened in currency markets sometimes, generally to lower the value of the Yen, although it refrains from doing it often due to political concerns of its main trading partners. The BoJ ultra-loose monetary policy between 2013 and 2024 caused the Yen to depreciate against its main currency peers due to an increasing policy divergence between the Bank of Japan and other main central banks. More recently, the gradually unwinding of this ultra-loose policy has given some support to the Yen.
Over the last decade, the BoJ’s stance of sticking to ultra-loose monetary policy has led to a widening policy divergence with other central banks, particularly with the US Federal Reserve. This supported a widening of the differential between the 10-year US and Japanese bonds, which favored the US Dollar against the Japanese Yen. The BoJ decision in 2024 to gradually abandon the ultra-loose policy, coupled with interest-rate cuts in other major central banks, is narrowing this differential.
The Japanese Yen is often seen as a safe-haven investment. This means that in times of market stress, investors are more likely to put their money in the Japanese currency due to its supposed reliability and stability. Turbulent times are likely to strengthen the Yen’s value against other currencies seen as more risky to invest in.
Recommended Articles


