


USD/JPY Forecast: Fed and BOJ Rate Hike Expectations Offset as Pair Drops Below 155, Will USD/JPY Fall Further?
TradingKey - As of the European session on September 7, the US dollar against the Japanese yen (USDJPY) traded weakly below 155.50. Although the US August non-farm payrolls released last week far exceeded expectations, briefly driving a rebound in the dollar, the yen's recent performance has remained strong. Rapidly heating expectations of a Bank of Japan rate hike in September, combined with market vigilance over potential FX intervention by the Japanese government, have caused USDJPY to fall continuously from around 164 in late July, with a cumulative drop of nearly 5%.
Why Is USD/JPY Falling?
From a fundamental perspective, the single biggest factor driving recent USDJPY movement is the shift in monetary policy expectations for the central banks of the U.S. and Japan.
On the U.S. dollar side, the U.S. August nonfarm payrolls report released last Friday was significantly stronger than market expectations. Nonfarm payrolls increased by 162,000, far exceeding market forecasts of around 56,000, while July's figure was revised from an initial contraction to positive growth. The strong employment data eased market concerns over a rapid cooling of the U.S. economy and gave the Federal Reserve more room to continue raising interest rates.
Following the nonfarm payrolls release, the market briefly raised its expectations for a September Fed rate hike. The latest rate market pricing shows roughly a 57% probability of a 25-basis-point rate hike by the Fed in September. In theory, higher U.S. rate expectations favor the dollar, causing USDJPY to rebound temporarily after the data. However, the extent of the rebound was relatively limited, largely because policy expectations for the Bank of Japan were also shifting noticeably toward the hawkish side.
Bank of Japan Governor Kazuo Ueda stated last week that the central bank will discuss policy options at its September meeting, including further rate hikes, and focus on evaluating upside risks to the economy and prices. As a result, the market significantly raised expectations for a BOJ rate hike in September. Investors have now largely priced in the likelihood of a 25-basis-point rate hike at the Sept. 17-18 meeting and have begun debating whether there is room for another hike in December.
Historically, USDJPY remained elevated for a prolonged period largely because U.S. interest rates were significantly higher than Japan's, allowing investors to borrow low-yielding yen to purchase U.S. dollar assets and earn yield differentials. However, if the BOJ continues to hike rates, the yield spread between the U.S. and Japan will gradually narrow, and some yen carry trades may unwind, thereby boosting yen buying.
Meanwhile, U.S. Treasury Secretary Scott Bessent also recently stated publicly that he believes the Japanese government and the BOJ will act to strengthen the yen, supporting Japan's adoption of appropriate monetary policies to avoid excessive exchange rate volatility. These statements further heightened market attention on Japan's policy normalization and potential foreign exchange intervention, increasing downward pressure on USDJPY.
For investors, the next major variable determining the direction of USDJPY will shift to the U.S. August inflation data. The U.S. will release PPI and CPI data this week, with CPI being particularly crucial for the Fed's September policy decision.
If U.S. CPI continues to come in higher than expected, the combination of 'strong employment + high inflation' could further increase the probability of Fed rate hikes, and a rise in U.S. Treasury yields could drive a rebound in USDJPY. Conversely, if CPI cools significantly, weakening market bets on a September Fed hike while BOJ rate hike expectations remain high, the U.S.-Japan yield spread could narrow further, potentially leading to further declines in USDJPY.
USD/JPY Technical Analysis
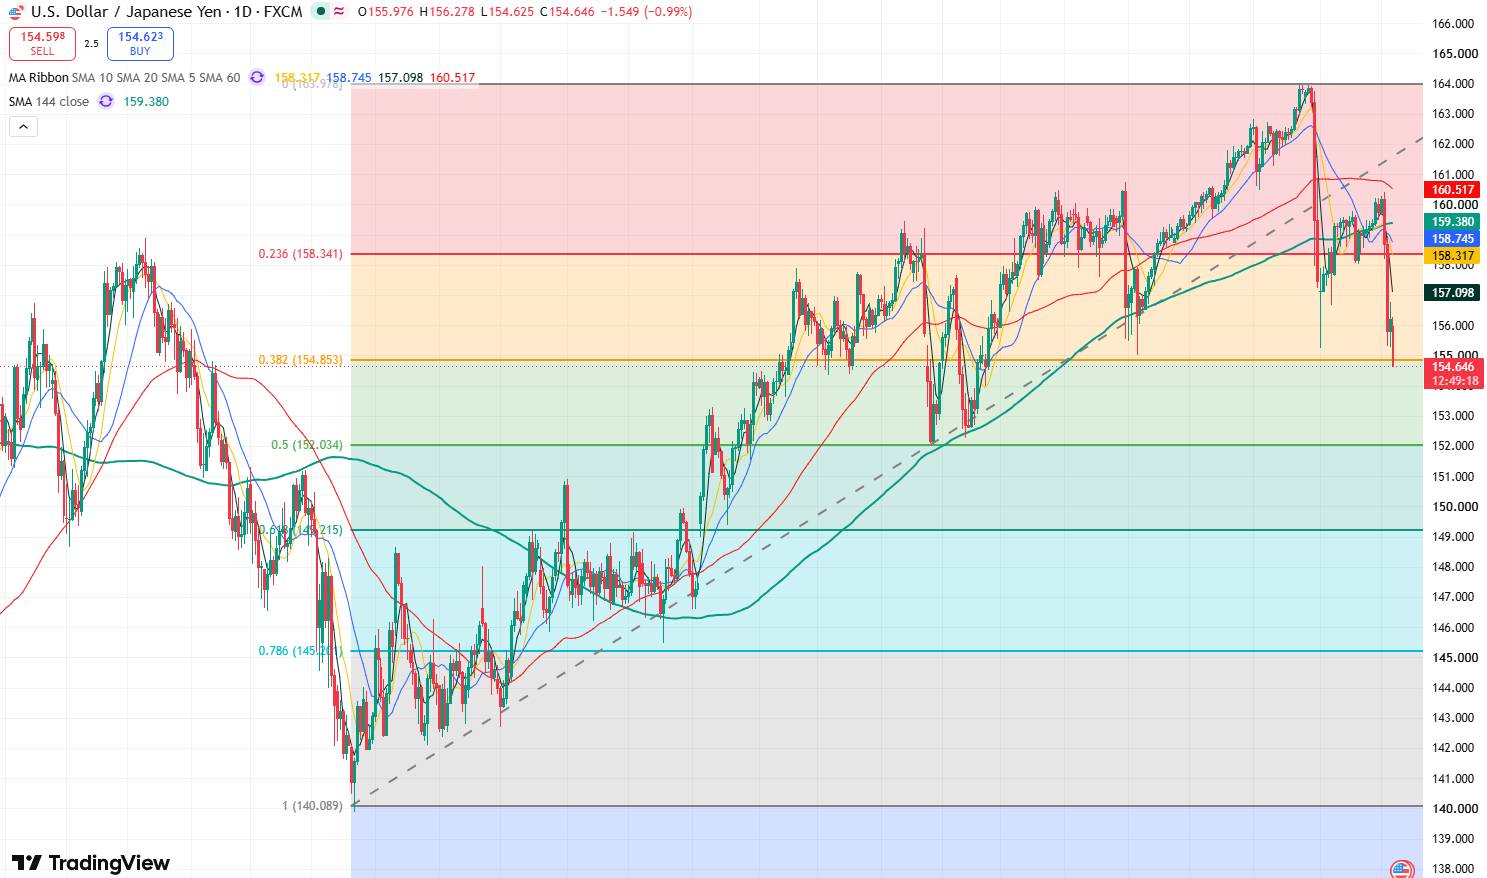
USD/JPY daily chart. Source: TradingView
On the USD/JPY daily chart, the exchange rate pulled back sharply after hitting a record high of 163.98 in July, dropping as low as 154.59, a decline of nearly 5%. Candlesticks crossed below multiple moving averages in succession, breaching both the 60-day and 144-day medium-to-long-term moving averages, indicating a clear cooling in the pair's previous medium-term upward trend.
Currently, USD/JPY has tested the key support level of 155.00 three consecutive times, dipping below this level intraday today. However, attention should be paid to whether today's closing price confirms a breakdown below 155.00. If today's close is below 155, the pair may enter a deeper downside phase, with the primary target testing 152.00. If this level is breached, the exchange rate could further test the 150.00 mark.
On the upside, the primary resistance level to watch for USD/JPY is near 157. If the pair can hold firmly above this level, it will open up upside space toward 158.10, with further gains potentially challenging the 160.00 threshold.
Recommended Articles


