


AUD/USD Price Forecast: Rising 20-day EMA backs more upside
- AUD/USD edges lower to near 0.7164 as the US Dollar ticks up.
- The US ISM Manufacturing PMI, JOLTS Job Openings, and Australia’s Q2 GDP data are awaited.
- The RBA is expected to deliver another interest rate hike this year.
The Australian Dollar (AUD) trades marginally lower at around 0.7164 against the US Dollar (USD) during the European trading session on Tuesday. The Aussie pair edges down as the US Dollar ticks higher due to surging United States (US) Treasury Yields amid rising oil prices due to renewed Middle East conflicts.
At press time, the US Dollar Index (DXY), which gauges the Greenback’s value against six major currencies, trades marginally higher to near 99.50. 10-year US Treasury Yields hit a fresh 19-month high at 4.78% and come closer to the multi-year high of 4.81%.
On the domestic front, the US ISM Manufacturing PMI data for August and the JOLTS Job Openings data for July are under the spotlight, which will be published at 14:00 GMT.
In Australia, investors await the Q2 Gross Domestic Product (GDP) data, which will be released on Wednesday.
Australia growth seen slowing as RBA faces renewed hike speculation
Analysts at ING’s Asia-Pacific research team expect Australian GDP growth to slow to “1.8% YoY in 2Q,” citing “ongoing weakness in the housing sector – including declining house prices – and softer residential investment.” They note that the upcoming release will be “closely watched following the upside surprise in July inflation, which has markets pricing in a higher probability of another Reserve Bank of Australia rate hike.” However, despite the shift in market expectations, ING says it “continue[s] to lean towards the RBA remaining on hold.”
AUD/USD Technical Analysis
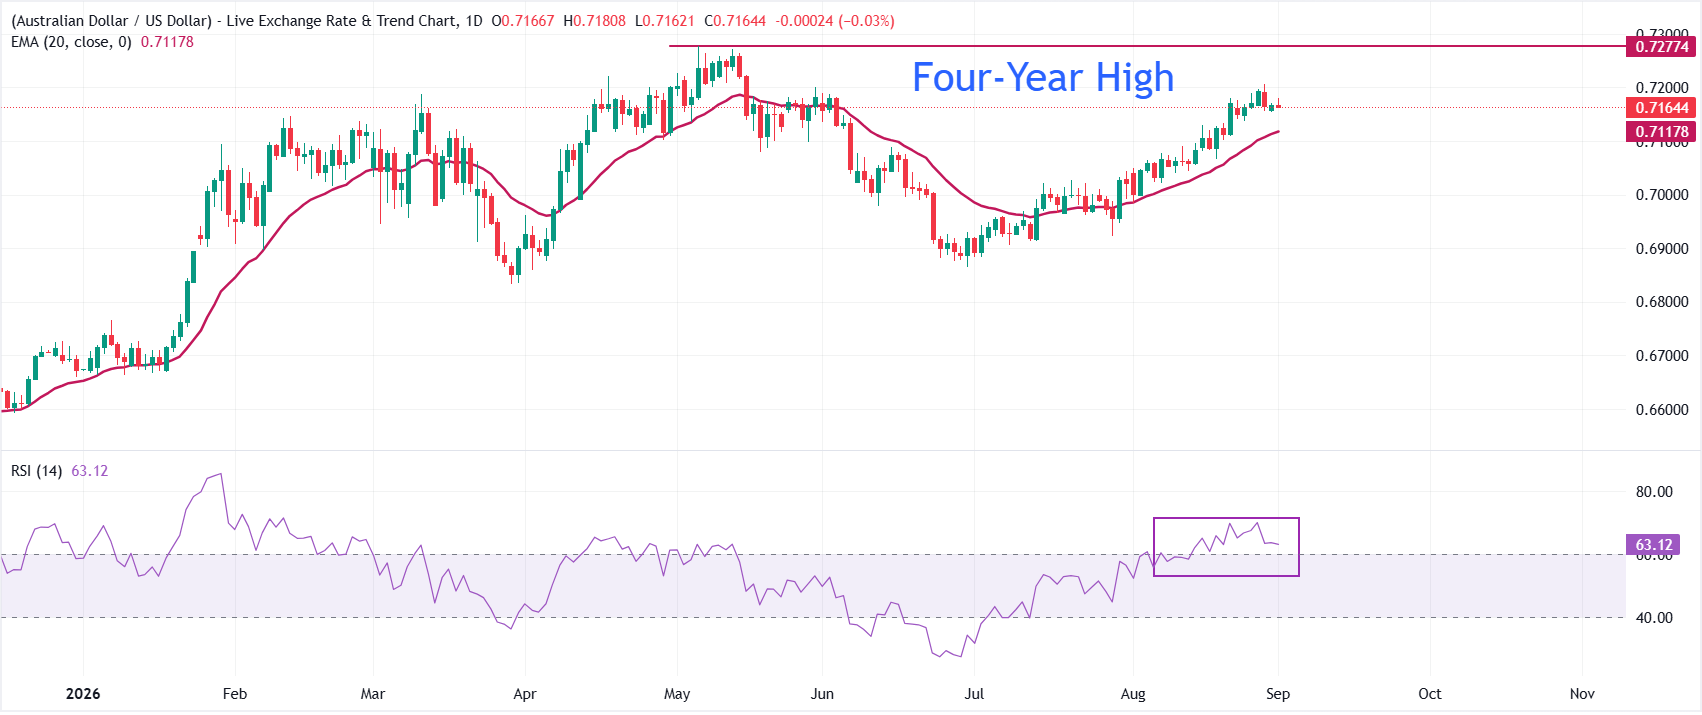
AUD/USD trades at 0.7164, retaining a bullish near-term bias as spot holds above the 20-period exponential moving average (EMA) at 0.7118. The pair’s position over this short-term EMA suggests underlying demand remains constructive, while the Relative Strength Index (14) at 63.09 stays in positive territory without reaching overbought conditions, hinting that buyers still have room to extend the advance.
On the downside, immediate support is located at the 20-day EMA at 0.7118, which represents the first line of defense in the event of a pullback. Looking up, the pair aims to extend the advance towards the four-year high at 0.7278.
(The technical analysis of this story was written with the help of an AI tool. Know more.)
Economic Indicator
Gross Domestic Product (YoY)
The Gross Domestic Product (GDP), released by the Australian Bureau of Statistics on a quarterly basis, is a measure of the total value of all goods and services produced in Australia during a given period. The GDP is considered as the main measure of Australian economic activity. The YoY reading compares economic activity in the reference quarter compared with the same quarter a year earlier. Generally, a rise in this indicator is bullish for the Australian Dollar (AUD), while a low reading is seen as bearish.
Read more.Next release: Wed Sep 02, 2026 01:30
Frequency: Quarterly
Consensus: 1.8%
Previous: 2.5%
Source: Australian Bureau of Statistics
The Australian Bureau of Statistics (ABS) releases the Gross Domestic Product (GDP) on a quarterly basis. It is published about 65 days after the quarter ends. The indicator is closely watched, as it paints an important picture for the economy. A strong labor market, rising wages and rising private capital expenditure data are critical for the country’s improved economic performance, which in turn impacts the Reserve Bank of Australia’s (RBA) monetary policy decision and the Australian dollar. Actual figures beating estimates is considered AUD bullish, as it could prompt the RBA to tighten its monetary policy.
Recommended Articles


