


Silver (XAGUSD) Is down by 2.40% on Sep 1: Is the Demand Outlook Changing?
Silver (XAGUSD) is down 2.40% at Sep 1 04:35(ET), now at $64.903, with a 7-day down of 5.39%.
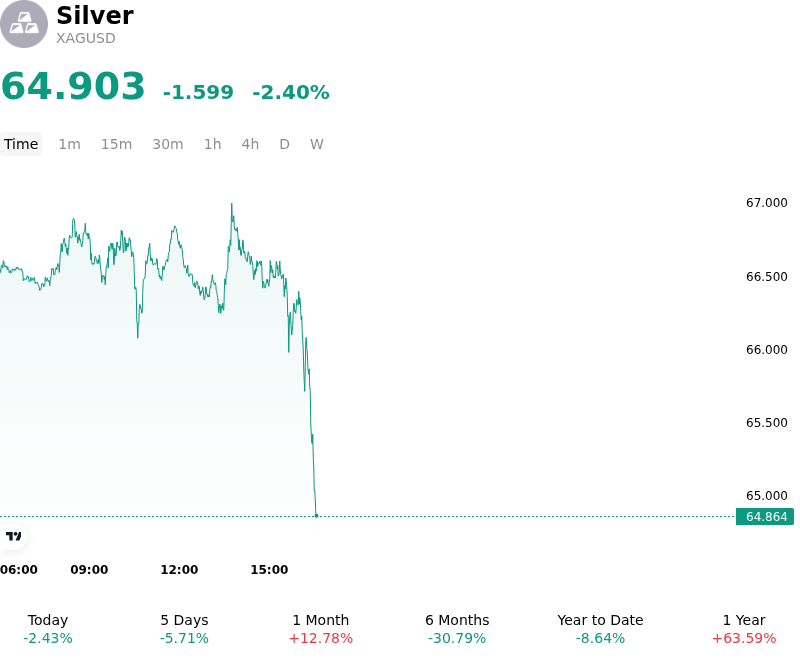
What is driving Silver (XAGUSD)’s stock price down today?
The spot silver market experienced notable downside pressure as institutional investors recalibrated monetary policy expectations following hawkish signals from Federal Reserve leadership at the Jackson Hole symposium. Comments emphasizing that the central bank remains willing to resume rate hikes if underlying inflation fails to converge toward target caused a sharp repricing across interest rate futures. With market-implied odds of near-term policy tightening rising substantially, U.S. Treasury yields pushed higher across the curve, elevating the real cost of capital. Because silver yields no interest income, higher real yields directly undermine its relative holding value, prompting widespread portfolio rebalancing out of non-yielding precious metals.
Compounding the hawkish macro narrative, a sharp escalation in energy prices added to global cost-push inflation concerns. Geopolitical friction in key Middle Eastern maritime corridors drove crude oil higher, generating spillover fears that sustained energy costs could prolong monetary tightening. The resulting firming of the U.S. dollar added an immediate headwind for dollar-denominated commodities, reducing international purchasing power and curbing marginal investment inflows into bullion assets.
From a market structure perspective, the retreat reflects profit-taking and momentum unwinding following a multi-week rally that pushed silver toward key overhead technical resistance. The inability to sustain a breakout above key technical zones triggered tactical liquidations among trend-following funds and systematic strategy desks. Breaching key short-term moving averages activated stop-loss orders, accelerating downside momentum during the trading session.
Despite the near-term macro-driven sell-off, silver's broader structural balance continues to be anchored by persistent physical tightness. The global market remains in its sixth consecutive annual supply shortfall, underpinned by robust industrial consumption across green technology applications, particularly solar photovoltaics and advanced electronics. Mine supply response remains constrained by declining ore grades and operational bottlenecks in major producing regions. Nevertheless, in the immediate term, macro-monetary liquidity, interest rate expectations, and currency movements continue to override physical deficit fundamentals in dictating daily price discovery.
Technical Analysis of Silver (XAGUSD)
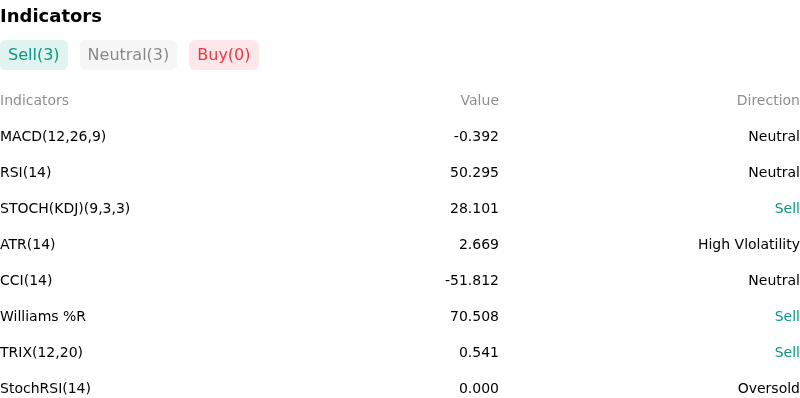
Technically, Silver (XAGUSD) shows a MACD (12,26,9) value of -0.392, indicating a neutral signal. The RSI at 50.295 suggests neutral condition and the Williams %R at 70.508 suggests sell condition. Please monitor closely.
More details about Silver (XAGUSD)
Recent Events and Risks:
- Hawkish Federal Reserve Expectations: Recent hawkish policy signals from Federal Reserve officials indicating elevated risks of further interest rate hikes have driven U.S. Treasury yields higher and strengthened the U.S. Dollar Index, significantly increasing the holding cost for non-yielding assets like silver.
- Slowing Industrial Demand and Alternative Substitution: Softening manufacturing activity in China and moderating growth expectations for domestic solar module production have dampened physical silver demand, while key industrial sectors accelerate substitution efforts toward cheaper metals such as copper and aluminum.
- Technical Breakdown and Long Unwind: XAGUSD suffered a sharp rejection at primary overhead resistance near $71.00–$72.00, breaking below its 100-day Simple Moving Average and triggering stops that have accelerated momentum-driven long liquidations and intraday downside pressure.
- Easing Physical Tightness and Gold-Silver Ratio Shifts: Unwinding physical tightness across spot market hubs combined with softening import demand in major Asian consumption centers has prompted institutional traders to rotate capital back toward gold, driving up the gold-to-silver ratio and exacerbating silver's relative underperformance.
Recommended Articles


