


Micro Silver (XAGUSD-M) Is down 2.50% on Sep 1: Why It Happened
Micro Silver (XAGUSD-M) is down 2.50% at Sep 1 04:45(ET), now at $64.84, with a 7-day down of 5.49%.
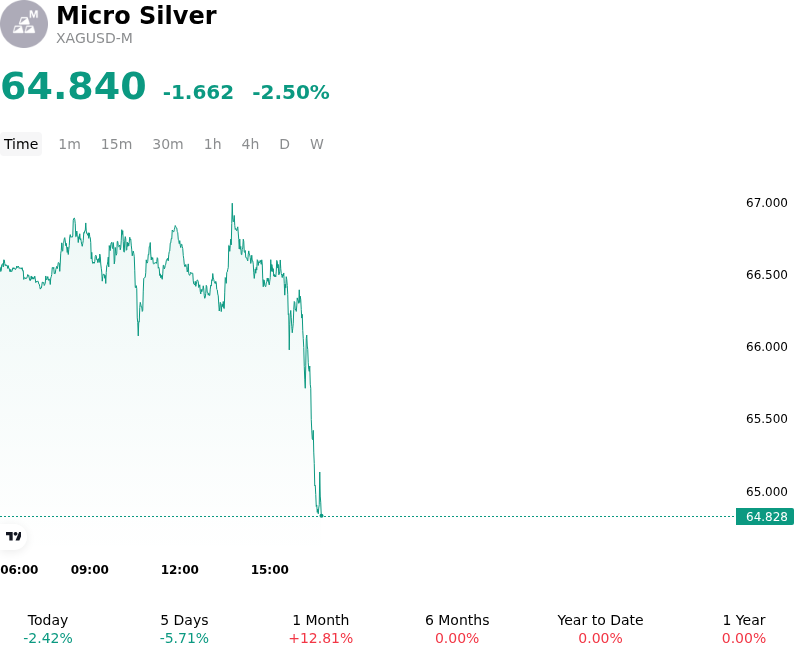
What is driving Micro Silver (XAGUSD-M)’s stock price down today?
The sharp downward pressure on spot silver reflects a broader repricing of US monetary policy expectations following hawkish signals from Federal Reserve leadership. Central bank messaging emphasizing persistent inflation risks and a willingness to resume interest rate increases elevated market-implied odds of policy tightening. This shift pushed US Treasury yields higher across the curve and strengthened the US dollar, directly raising the opportunity cost of holding non-yielding precious metals. Institutional capital responded by paring back long exposure in hard assets, favoring yielding instruments amid recalibrated real-rate expectations.
Compounding the hawkish macro backdrop, escalating energy prices and geopolitical friction in key Middle Eastern shipping corridors fueled broader cost-push inflation concerns. Higher crude oil prices reinforced fears that headline inflation could remain sticky above central bank targets, cementing expectations for a prolonged period of restrictive monetary policy. The resulting firming of the US dollar imposed an additional headwind on dollar-denominated commodities by reducing international purchasing power and dampening marginal investment demand.
From a positioning and technical standpoint, the decline represents an unwinding of tactical momentum and profit-taking following recent multi-week gains. As prices tested strong technical resistance levels, the failure to secure a sustained upside breakout triggered stop-loss sell orders and speculative position liquidations. Short-term trading flows shifted in favor of downside momentum as prices breached key short-term moving averages, encouraging systematic and trend-following funds to reduce risk exposure.
While physical supply-demand dynamics remain structurally tight, near-term pricing continues to be dominated by macro financial flows rather than physical balances. Industry projections point to a sixth consecutive annual global deficit driven by structural demand from photovoltaic manufacturing, electronics, and technology infrastructure. However, available above-ground inventories have cushioned immediate physical supply constraints, allowing interest rate expectations, real yields, and currency volatility to dictate short-term price action. Investors continue to monitor upcoming economic growth indicators, labor market data, and central bank communications to gauge whether the pullback marks a temporary macro-driven correction or the start of extended consolidation.
Technical Analysis of Micro Silver (XAGUSD-M)
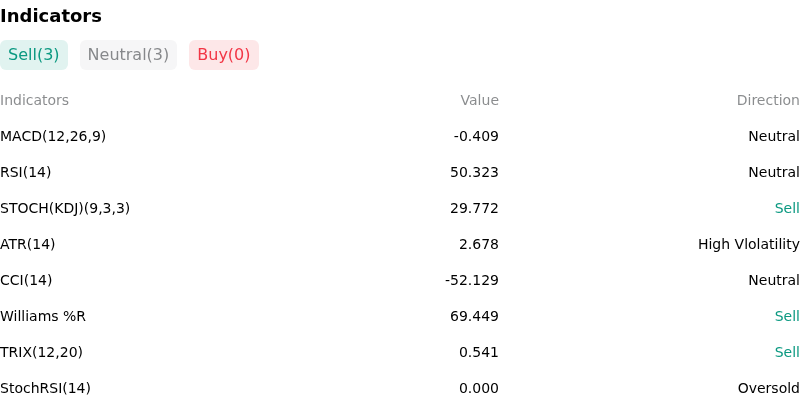
Technically, Micro Silver (XAGUSD-M) shows a MACD (12,26,9) value of -0.431, indicating a neutral signal. The RSI at 49.836 suggests neutral condition and the Williams %R at 71.362 suggests sell condition. Please monitor closely.
More details about Micro Silver (XAGUSD-M)
Recent Events and Risks:
- Hawkish Fed Outlook and Yield Surge: Hawkish signals from Federal Reserve leadership indicating potential rate increases at the upcoming September meeting pushed the 2-year U.S. Treasury yield above 4.3% and lifted the U.S. Dollar Index. The rise in real yields increases the holding cost of non-interest-bearing assets, triggering sharp downside pressure and driving intraday declines in spot XAGUSD.
- Industrial Fabrication Slowdown and Solar Thrifting: Industry forecasts from the Silver Institute project global silver industrial fabrication to fall to a multi-year low, led by a expected 19% drop in photovoltaic (PV) solar demand. Solar manufacturers in China and globally are accelerating technological thrifting and material substitution away from silver to reduce production costs, undercutting structural industrial demand.
- Technical Resistance Failure and Speculative Long Unwinding: XAGUSD experienced a sharp intraday reversal after failing to sustain gains above key overhead resistance around the $71–$72 zone. Silver's high beta relative to gold amplified liquidation stress once prices fell below short-term equilibrium levels, exposing deeper technical support targets between $63 and $65.
- Contraction in Asian Physical Retail Demand: Prolonged price volatility and elevated retail costs continue to depress physical demand across major Asian consuming hubs, particularly India. Projections for a 9% contraction in global jewelry demand and a 17% drop in silverware fabrication reflect weakening physical spot buying, leaving the market more exposed to macroeconomic risk-off flows.
Recommended Articles


