


Natural Gas - Futures (NATGAS-F) Surges on Oct 8: Key Factors to Watch
Natural Gas - Futures (NATGAS-F) is up 2.09% at Oct 8 21:55(ET), now at $3.274, with a 7-day up of 11.28%.
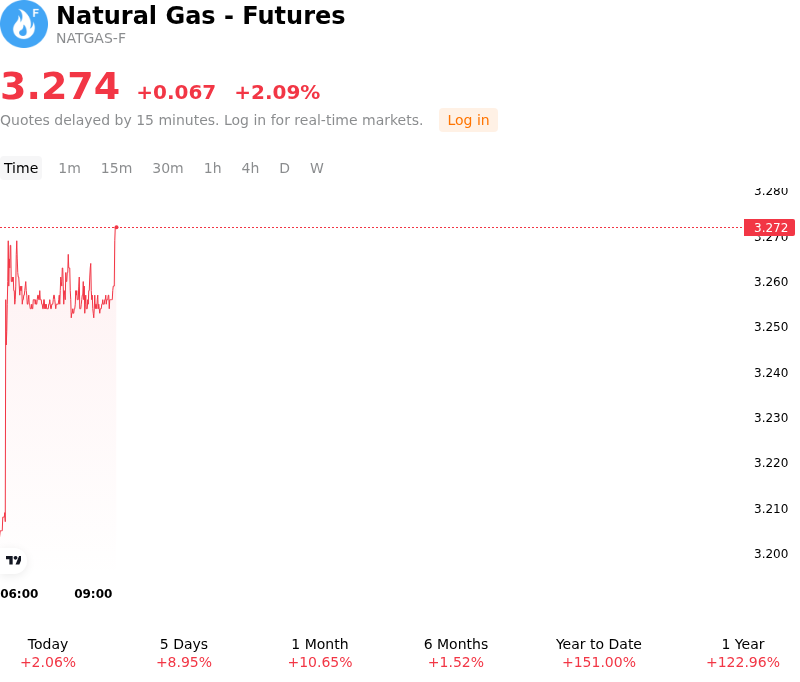
What is driving Natural Gas - Futures (NATGAS-F)’s stock price up today?
Natural gas futures advanced as a tightening U.S. supply-demand balance and expectations of smaller weekly storage builds provided strong upward momentum. Daily domestic dry gas production experienced a modest pullback due to voluntary producer output curtailments and scheduled autumn pipeline maintenance across major Appalachian producing basins. Concurrently, market participants repriced storage expectations ahead of upcoming inventory data, anticipating a below-average working gas injection relative to historical norms for early October. Smaller net injections have begun steadily eroding the seasonal inventory overhang, prompting traders to adjust buffer expectations as the market approaches the winter withdrawal period.
Demand-side fundamentals further supported the price rally through a combination of shifting weather forecasts and resilient liquefied natural gas feedgas flows. Updated meteorological models pointed to cooler air moving across northern and western regions of the United States, signaling an early emergence of residential and commercial heating demand. On the export front, feedgas deliveries to domestic export facilities remained robust, underpinned by firm European and Asian benchmark pricing and ongoing international supply security concerns. Stable power-sector burn also continued to absorb domestic volumes, helping to balance the market during the transitional shoulder season.
From a market structure perspective, the convergence of constrained daily supply, narrowing storage surpluses, and early autumn demand expectations spurred institutional short-covering and speculative buying in front-month contracts. This upward momentum reflects a re-evaluation of winter risk premiums as market participants re-align positions with a tighter forward market balance. Moving forward, institutional investors continue to monitor medium-term weather pattern trends, the final trajectory of storage inventories before heating season begins, and potential producer responses to firming spot prices.
Technical Analysis of Natural Gas - Futures (NATGAS-F)
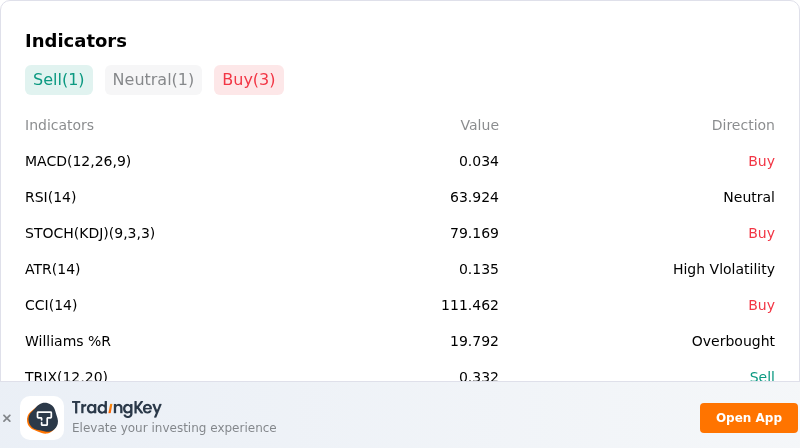
Technically, Natural Gas - Futures (NATGAS-F) shows a MACD (12,26,9) value of 0.034, indicating a buy signal. The RSI at 63.924 suggests neutral condition and the Williams %R at 19.792 suggests overbought condition. Please monitor closely.
More details about Natural Gas - Futures (NATGAS-F)
Recent Events and Risks:
- Near-Record Storage Inventory Cushion: U.S. working natural gas inventories are tracking above five-year seasonal averages and are projected by the EIA to approach nearly 4.0 trillion cubic feet (Tcf) by late October, creating a substantial supply cushion that caps intraday rallies and exposes futures to downside position unwinds.
- Elevated U.S. Dry Production Volumes: Lower-48 dry gas production continues to operate near record levels at approximately 110.8 Bcf/d, consistently matching or outpacing incremental demand growth and limiting the durability of technical rebounds.
- Unseasonably Mild Weather and El Niño Heating Demand Risks: Near-term meteorological models show above-normal shoulder-season temperatures across major population centers, while long-range outlooks for a strong El Niño threaten to diminish winter heating degree days and suppress space-heating demand.
- LNG Export Intake Interruptions: Regional feedgas intake remains vulnerable to sudden downside volatility caused by annual terminal maintenance outages (such as at Cove Point) and reduced operational capacity at newer liquefaction facilities, temporarily stranding excess gas in domestic markets.
Recommended Articles


