


Sterling Infrastructure Inc Stock (STRL) Closed Up by 7.71% on Oct 6: A Full Analysis
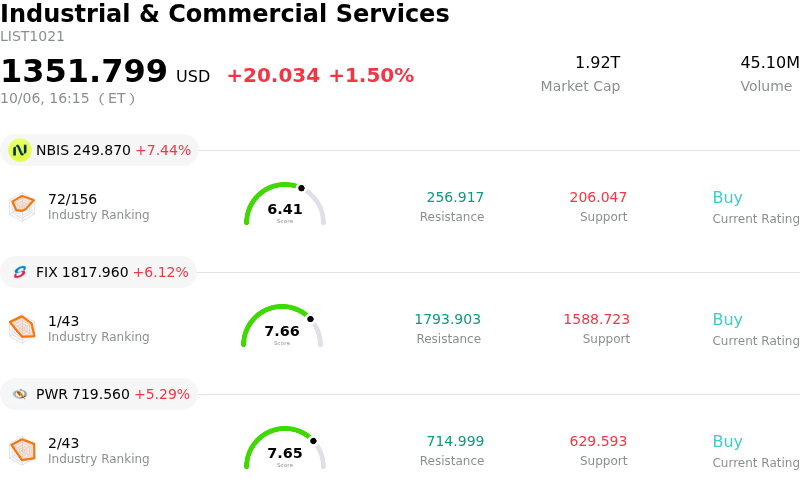
Sterling Infrastructure Inc (STRL) closed up by 7.71%. The Industrial & Commercial Services sector is up by 1.50%. The company outperformed the industry. Top 3 stocks by turnover in the sector: Nebius Group NV (NBIS) up 7.44%; Comfort Systems USA Inc (FIX) up 6.12%; Quanta Services Inc (PWR) up 5.29%.
What is driving Sterling Infrastructure Inc (STRL)’s stock price up today?
Sterling Infrastructure experienced notable upward price action, driven by positive sell-side estimate revisions and renewed momentum across the broader industrial and infrastructure sectors. Market sentiment was lifted following upgrades in earnings research ratings that highlighted the company's improving fiscal trajectory. Institutional confidence continues to be reinforced by Wall Street analyst coverage maintaining bullish outlooks, backed by price targets that sit well above prevailing trading levels and reflect robust visibility into future earnings.
A primary fundamental driver behind this constructive sentiment is the company's strategic focus on its high-margin E-Infrastructure Solutions segment. By securing long-duration contracts for mission-critical projects—including hyperscale artificial intelligence data centers, semiconductor fabrication facilities, and advanced manufacturing campuses—Sterling has effectively transformed its backlog away from traditional low-margin civil construction. Furthermore, recent corporate governance updates, including the strategic appointment of new senior executive leadership over legal and compliance functions, have reassured institutional investors of organizational stability during this expansion phase.
From a market strategy perspective, the movement reflects strong buying interest as institutional participants re-engage following a period of price consolidation. While elevated valuation multiples require flawless project execution, multi-year secular tailwinds surrounding technology infrastructure buildouts continue to provide a solid foundation. Investors remain focused on upcoming quarterly updates and backlog conversion to gauge the long-term durability of the company's growth trajectory.
Technical Analysis of Sterling Infrastructure Inc (STRL)
Technically, Sterling Infrastructure Inc (STRL) shows a MACD (12,26,9) value of 16.015, indicating a neutral signal. The RSI at 61.467 suggests neutral condition and the Williams %R at 11.998 suggests overbought condition. Please monitor closely.
Fundamental Analysis of Sterling Infrastructure Inc (STRL)
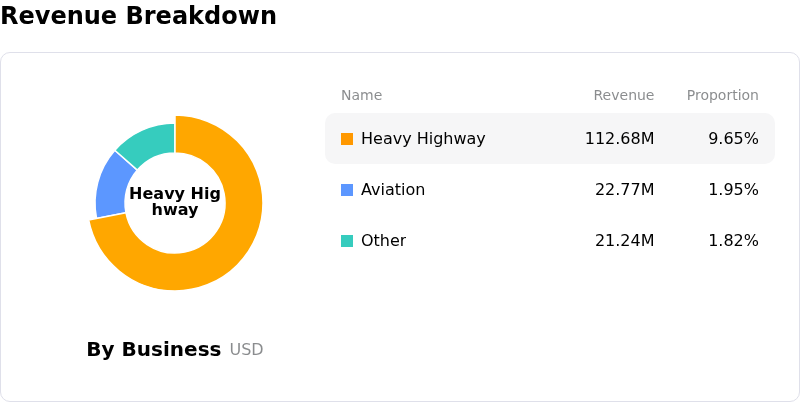
Sterling Infrastructure Inc (STRL) is in the Industrial & Commercial Services industry. Its latest annual revenue is $2.49B, ranking 25 in the industry. The net profit is $290.15M, ranking 12 in the industry. Company Profile
Over the past month, multiple analysts have rated the company as Strong Buy, with an average price target of $852.14, a high of $1015.00, and a low of $700.00.
More details about Sterling Infrastructure Inc (STRL)
Company Specific Risks:
- Execution and Labor Capacity Constraints: Capacity bottlenecks in specialized labor and equipment threaten Sterling's ability to efficiently convert its $4.33 billion project backlog in data centers and semiconductor facilities into realized revenue.
- Elevated Valuation and Re-pricing Risk: Trading at a P/E multiple near 38x—substantially above its 5-year median of 20.8x—the stock remains vulnerable to sharp intraday sell-offs on macro shifts or minor sentiment changes.
- Hyperscaler CapEx Concentration: Increasing operational reliance on mission-critical E-Infrastructure exposes earnings to severe downside should major technology clients defer or reduce their data center capital expenditure budgets.
- Persistent Insider Selling and Dilution Overhang: Market sentiment is burdened by over $96 million in executive insider share dispositions over the past year with zero insider purchases, alongside an active Form S-3 shelf registration that signals potential share dilution.
Recommended Articles


