


USD/MXN (USDMXN) Surges 0.56% on Oct 5: What Does the Market Value?
USD/MXN (USDMXN) is up 0.56% at Oct 5 02:40(ET), now at $18.25303, with a 7-day up of 1.50%.
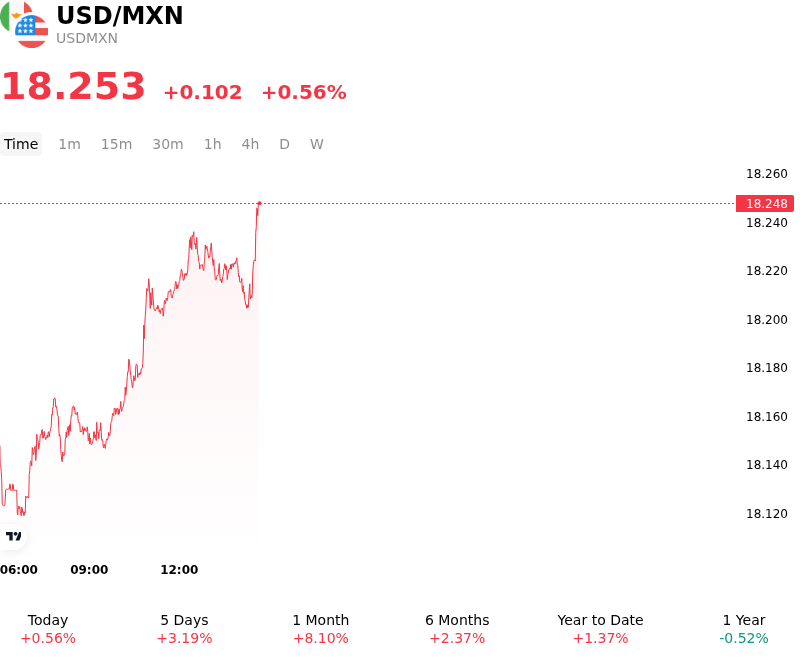
What is driving USD/MXN (USDMXN)’s stock price up today?
The upward pressure on USDMXN reflects a widening divergence in monetary policy expectations between the Federal Reserve and Banco de México, which has progressively compressed the interest-rate differential historically favoring the Mexican peso. Following the Federal Reserve's recent rate hike and hawkish communications signaling a commitment to curbing inflation, US Treasury yields have remained supported. In contrast, Banxico held its benchmark overnight rate steady while modifying its forward guidance to remove explicit language regarding a prolonged pause. This adjustment signaled to markets that Mexican policymakers are increasingly attentive to domestic economic slack and downside growth risks, opening the door for future policy flexibility. As a result, expectations of a narrowing yield spread between the US and Mexico have reduced the return on the peso carry trade, prompting institutional investors to scale back peso allocations.
Beyond interest-rate differentials, broader risk sentiment and global macro headwinds provided additional tailwinds for the US dollar against high-beta emerging market currencies. Elevated US bond yields, alongside ongoing trade policy uncertainties and geopolitical friction, encouraged a more cautious risk environment. In times of heightened global macro uncertainty, international capital flows naturally pivot toward liquid dollar-based safe havens, leaving spot emerging market exchange rates vulnerable to selling pressure. The Mexican peso, despite its solid structural liquidity, remains sensitive to shifts in global risk appetite and international capital reallocations.
From an institutional positioning standpoint, the move in USDMXN reflects systematic short-covering and portfolio adjustments by macro funds responding to the evolving yield trajectory. As the carry buffer thins relative to US fixed-income yields, downside protection for the peso has eroded, encouraging momentum-based buying in the currency pair. Looking ahead, market participants will continue to focus on incoming economic data from both economies, particularly inflation prints and growth indicators, to determine whether this move marks a sustained structural trend or a temporary consolidation around key technical levels.
Technical Analysis of USD/MXN (USDMXN)
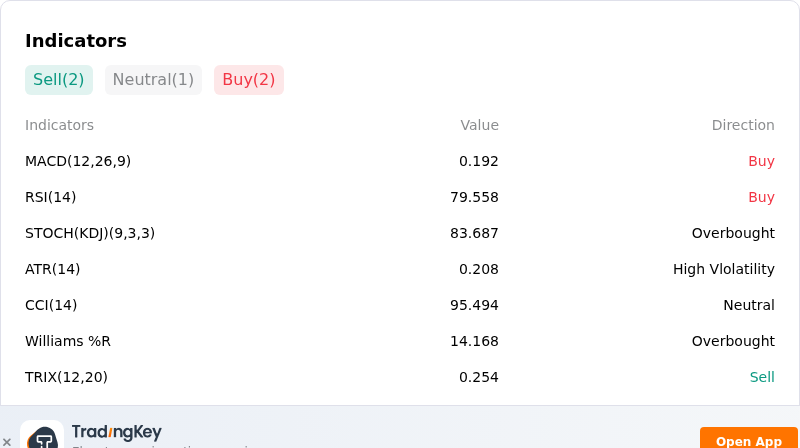
Technically, USD/MXN (USDMXN) shows a MACD (12,26,9) value of 0.190, indicating a buy signal. The RSI at 79.295 suggests buy condition and the Williams %R at 15.396 suggests overbought condition. Please monitor closely.
More details about USD/MXN (USDMXN)
Recent Events and Risks:
- Banxico-Fed Policy Divergence and Carry Erosion: Banco de México's decision to maintain its policy rate at 6.50% while explicitly stating it will not mechanically follow Federal Reserve rate adjustments has narrowed the U.S.-Mexico yield spread, incentivizing carry trade unwinds and fueling intraday upside volatility in USD/MXN.
- Hawkish Federal Reserve Rhetoric and Yield Spikes: Stronger U.S. labor market data alongside persistent hawkish commentary from Federal Reserve officials has pushed U.S. Treasury yields higher, boosting demand for safe-haven U.S. dollars over high-beta emerging market currencies like the Mexican peso.
- Easing Domestic Inflation and Slowing Mexican Growth: Steady disinflation toward Banxico's target combined with downside risks to Mexican GDP growth reduces the likelihood of future domestic rate hikes, leaving the peso vulnerable to sudden shifts in investor risk appetite.
- Global Risk Aversion and Trade Policy Uncertainty: Heightened geopolitical tensions, elevated crude oil volatility, and market anxieties concerning North American trade relations and upcoming USMCA reviews are triggering risk-off capital outflows away from Mexican assets.
Recommended Articles


