


Brent Futures (UKOIL-F) Moved Sharply on Oct 1: Inventories, the Dollar, or Geopolitics?
Brent Futures (UKOIL-F) is up 2.34% at Oct 1 03:30(ET), now at $100.17, with a 7-day down of 0.27%.
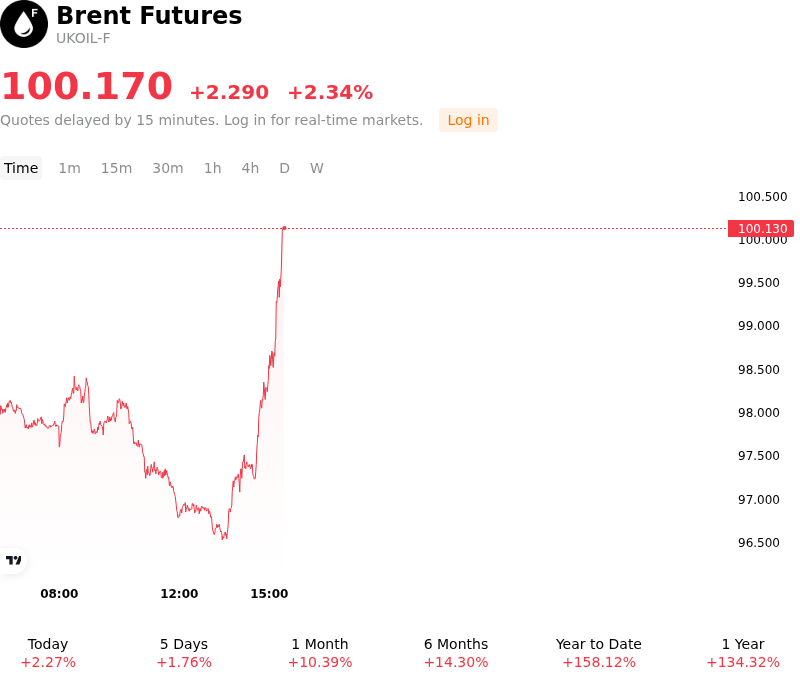
What is driving Brent Futures (UKOIL-F)’s stock price up today?
Geopolitical friction across key Middle Eastern transit corridors continues to underpin an elevated risk premium in global crude benchmark pricing. Ongoing uncertainty surrounding diplomatic negotiations and lingering security threats in critical maritime choke points, including the Strait of Hormuz, have renewed market concerns regarding the durability of regional export flows. Supply expectations remain constrained as traders weigh recurring logistics bottlenecks and potential transit disruptions against slow regional recovery efforts. Furthermore, extended export restrictions on refined petroleum products by major producing nations continue to tighten the broader global supply balance, providing immediate structural support to prompt Brent futures.
Compounding supply-side vulnerabilities, physical market fundamentals demonstrate persistent tightness across major refining hubs. Global commercial petroleum stockpiles, particularly middle distillates such as diesel and heating oil, remain constrained below historical averages. Robust refinery utilization aimed at addressing tight refined product markets has sustained strong commercial crude intake, drawing down available spot supply and reinforcing physical Atlantic Basin market tightness. This fundamental imbalance is clearly reflected in the steep backwardation across the front end of the Brent futures curve, signaling that near-term physical tightness continues to outweigh longer-dated supply expectations.
Institutional positioning and capital flows at the beginning of the quarterly period further amplified the upward movement. Institutional market participants adjusted allocations to energy derivatives to hedge against supply disruption risks, while systematic strategies responded to strengthening physical prompt spreads. Although investors continue to monitor broader macroeconomic indicators and foreign exchange fluctuations, the immediate market pricing reflects a dominant supply-side premium driven by structural inventory deficits, transit security risks, and resilient physical demand.
Technical Analysis of Brent Futures (UKOIL-F)
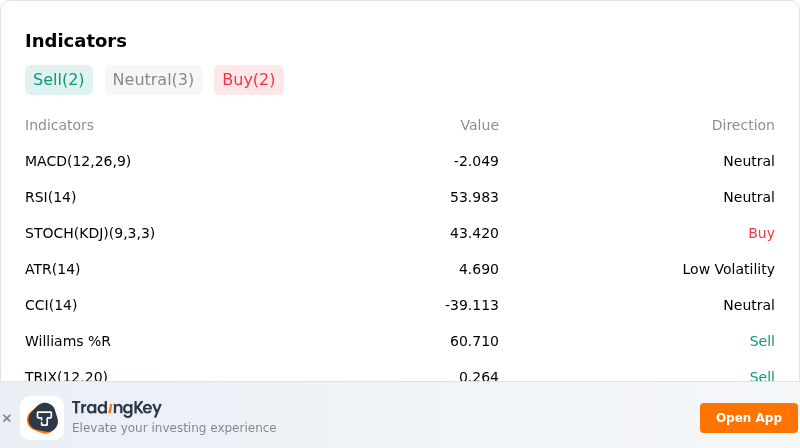
Technically, Brent Futures (UKOIL-F) shows a MACD (12,26,9) value of -2.049, indicating a neutral signal. The RSI at 53.983 suggests neutral condition and the Williams %R at 60.710 suggests sell condition. Please monitor closely.
More details about Brent Futures (UKOIL-F)
Recent Events and Risks:
- Recovery in Regional Gulf Exports and Pipeline Logistics: Reports that crude exports from the Middle East are recovering toward pre-war levels—facilitated by Saudi Arabia restoring East-West pipeline capacity and utilizing ship-to-ship transfers—are mitigating physical tightness concerns and unwinding prompt geopolitical risk premiums.
- Diplomatic Headwinds from U.S.-Iran Negotiations: Ongoing diplomatic discussions between the U.S. and Iran regarding regional stability and supply channels are reducing market anxiety over major supply outages, prompting institutional traders to unwind speculative long exposure.
- Unexpected Increase in Weekly Commercial Crude Stocks: Data from the Energy Information Administration (EIA) revealed a surprise U.S. crude inventory build of 0.922 million barrels against consensus expectations of a drawdown, highlighting near-term domestic oversupply and exerting downward pressure on international benchmarks.
- Technical Resistance Rejection and U.S. Dollar Strength: Intraday price action showed a clear rejection at the $98–$100 resistance zone and the 50-day Exponential Moving Average, triggering automated technical selling and long unwinding amid a firming U.S. Dollar Index.
Recommended Articles


