


Grab Holdings Ltd Stock (GRAB) Moved Down by 7.23% on Sep 9: A Full Analysis
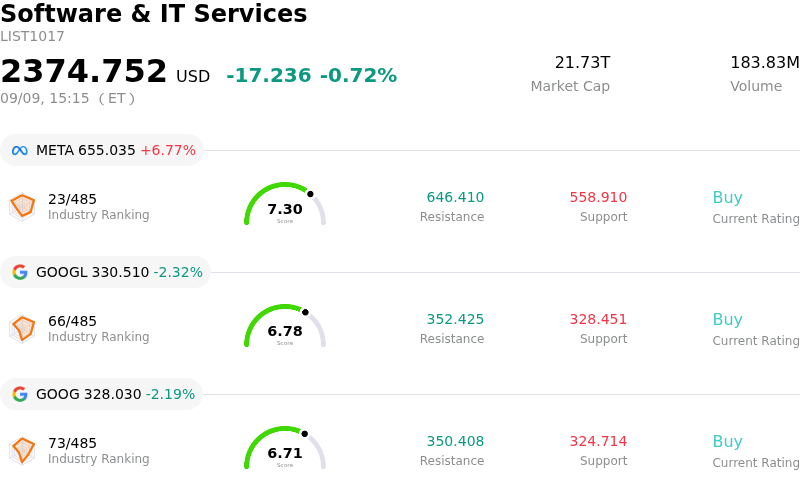
Grab Holdings Ltd (GRAB) moved down by 7.23%. The Software & IT Services sector is down by 0.72%. The company underperformed the industry. Top 3 stocks by turnover in the sector: Meta Platforms Inc (META) up 6.77%; Alphabet Inc Class A (GOOGL) down 2.31%; Alphabet Inc Class C (GOOG) down 2.19%.
What is driving Grab Holdings Ltd (GRAB)’s stock price down today?
Grab Holdings experienced a sharp decline driven primarily by a confluence of insider selling disclosures, regulatory uncertainties in core Southeast Asian operating markets, and persistent market skepticism regarding long-term top-line momentum.
The immediate catalyst pressuring sentiment stems from recent regulatory SEC filings detailing notable insider share sales by executive leadership, including Chief Executive Officer Anthony Tan, Chief Operating Officer Alexander Hungate, and other senior officers. Although these transactions were executed under pre-arranged Rule 10b5-1 trading plans designed for routine liquidity management, the public disclosure of multi-executive dispositions has intensified market anxiety over management confidence, prompting both retail and institutional investors to reduce exposure.
Beyond insider activity, mounting regulatory concerns across Southeast Asia have created persistent headwinds for the super-app operator. Market participants are closely watching policy developments in critical growth markets, particularly Indonesia, where potential proposals regarding driver commission caps and gig-economy labor protections could compress take rates across both the Mobility and Deliveries segments. Investors worry that tighter regulatory constraints could limit Grab's ability to maintain its target adjusted EBITDA margins without dampening driver retention or platform usage.
Fundamental growth concerns have further amplified the selling pressure. Despite previous quarterly operational beats and corporate buyback approvals, market focus has increasingly pivoted toward structural top-line deceleration compared to historical growth phases, alongside questions surrounding long-term free cash flow generation. The macroeconomic backdrop across emerging Asia, coupled with aggressive regional competition in ride-hailing and digital financial services, continues to cap valuation multiples.
From a market dynamics perspective, the downward move forced the stock into a technical breakdown, breaching critical support levels and setting new multi-month lows. This technical deterioration accelerated automated selling, triggered trailing stop-loss orders, and invited short-side momentum trading, escalating the overall intraday volatility.
Technical Analysis of Grab Holdings Ltd (GRAB)
Technically, Grab Holdings Ltd (GRAB) shows a MACD (12,26,9) value of -0.096, indicating a sell signal. The RSI at 27.577 suggests sell condition and the Williams %R at 98.485 suggests oversold condition. Please monitor closely.
Fundamental Analysis of Grab Holdings Ltd (GRAB)
Grab Holdings Ltd (GRAB) is in the Software & IT Services industry. Its latest annual revenue is $3.37B, ranking 85 in the industry. The net profit is $268.00M, ranking 95 in the industry. Company Profile
Over the past month, multiple analysts have rated the company as Buy, with an average price target of $5.84, a high of $8.00, and a low of $4.60.
More details about Grab Holdings Ltd (GRAB)
Company Specific Risks:
- Executive Insider Liquidation: Recent Form 4 and Form 144 SEC filings revealed substantial insider share sales by executive leadership, including CEO Anthony Tan selling 400,000 shares and COO Alexander Hungate selling over 145,000 shares, stoking institutional concern over management confidence and driving shares toward new 52-week lows.
- Regulatory Risks on Driver Commissions: Intraday volatility has intensified amid mounting regulatory scrutiny in core markets such as Indonesia over proposed driver commission caps, threatening to compress take-rates and squeeze profit margins across Grab's core mobility and delivery operations.
- Persistent Profitability and Cash Flow Deficits: Institutional analysts highlight fundamental vulnerabilities, including weak organic cash generation and negative pretax operating margins, leaving the business reliant on outside capital or aggressive cost reductions to support long-term expansion.
- Slowing Mobility Demand and Rating Downgrades: Bearish sentiment is growing around decelerating growth in Southeast Asian ride-hailing demand, prompting target cuts by firms such as Barclays and triggering technical breakdowns below all major moving averages.
Recommended Articles


