


Solana (SOLUSD) Is up 1.21% on Sep 9: Here Is Why
Solana (SOLUSD) is up 1.21% at Sep 9 00:45(ET), now at $103.32, with a 7-day up of 4.67%.
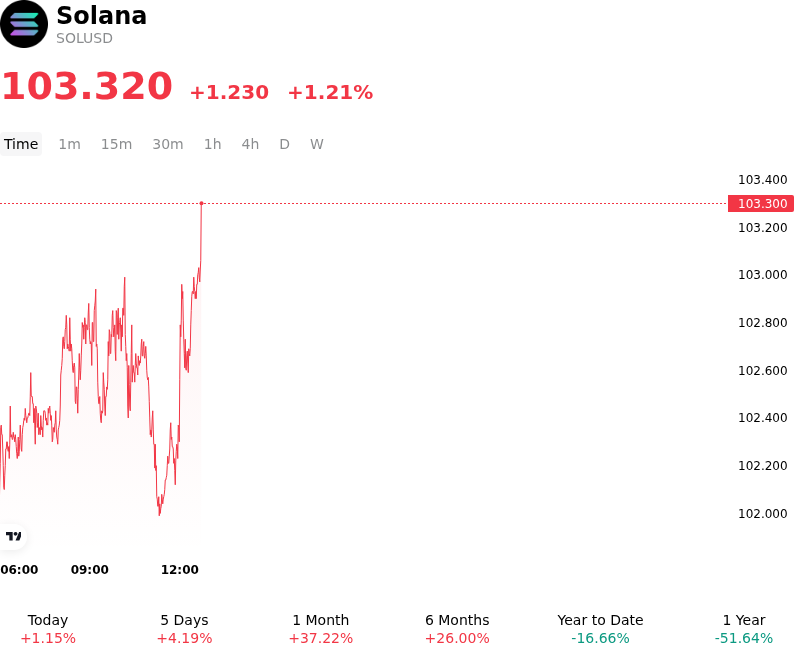
What is driving Solana (SOLUSD)’s stock price up today?
Capital flowed into Solana as market participants responded positively to the scheduled mainnet activation of the Transaction V1 network upgrade. The protocol update significantly expands maximum transaction data capacity from 1,232 bytes to 4,096 bytes, expanding throughput capabilities for complex execution environments. By enabling atomic execution of zero-knowledge proofs, multi-signature transactions, and data-intensive decentralized application logic within a single transaction payload, the upgrade improves Solana's competitive positioning relative to competing Layer-1 blockchains and enhances long-term scalability and institutional adoption expectations.
The positive price action was reinforced by targeted derivatives positioning and constructive capital flows. On-chain derivatives metrics highlighted notable accumulation in long futures contracts leading into the event, as sophisticated traders and large market participants positioned for an asset-specific repricing. Despite broader macroeconomic friction stemming from elevated Treasury yields and cautious Federal Reserve monetary policy expectations, Solana benefited from ongoing institutional participation, robust decentralized exchange turnover, and sustained real-world asset settlement activity, providing firm underlying spot market demand and absorbing short-term selling pressure.
From a market structure perspective, the advance reaffirmed Solana's broader trend integrity, maintaining price action above key daily moving averages and stabilizing market sentiment. The ability to hold key technical support zones reflects expanding liquidity and localized risk appetite for high-throughput smart contract platforms. While investors continue to monitor global liquidity conditions, interest rate expectations, and developer adoption rates following protocol changes, the session's performance highlights a market driven by concrete network developments and asset-specific growth drivers.
Technical Analysis of Solana (SOLUSD)
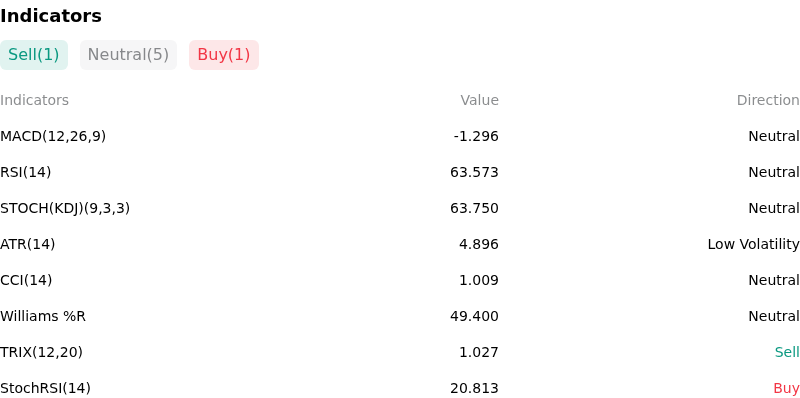
Technically, Solana (SOLUSD) shows a MACD (12,26,9) value of -1.296, indicating a neutral signal. The RSI at 63.573 suggests neutral condition and the Williams %R at 49.400 suggests neutral condition. Please monitor closely.
More details about Solana (SOLUSD)
Recent Events and Risks:
- Technical Resistance and Short-Term Momentum Loss: SOLUSD is encountering strong overhead resistance in the $105–$107 range, with lower-timeframe momentum indicators turning bearish as hourly MACD flips negative, elevating the risk of a breakdown below critical $103 support toward the $97–$98 moving average zone.
- Derivatives Overcrowded Longs and Liquidation Cascades: Derivatives markets show heavily skewed long positioning exceeding 65%, leaving the market vulnerable to sharp deleveraging events and long-liquidation cascades if downward pressure triggers stop-loss clusters below $100.
- Protocol Upgrade Execution and Validator Transition Risks: The mainnet activation of the Transaction V1 upgrade (expanding transaction payload size to 4,096 bytes under SIMD-0296) introduces near-term technical execution, node client compatibility, and network operational risks during the validator transition.
- On-Chain Fee Sensitivity and DEX Volume Volatility: Protocol revenue and network fee capture remain highly reliant on cyclical speculative trading and DEX activity, exposing spot prices to liquidity shocks if DEX volume growth stalls or capital rotates out of Solana-based DeFi applications.
Recommended Articles


