


Vertex Pharmaceuticals Inc Stock (VRTX) Moved Down by 3.06% on Sep 8: What Signal Does It Send?
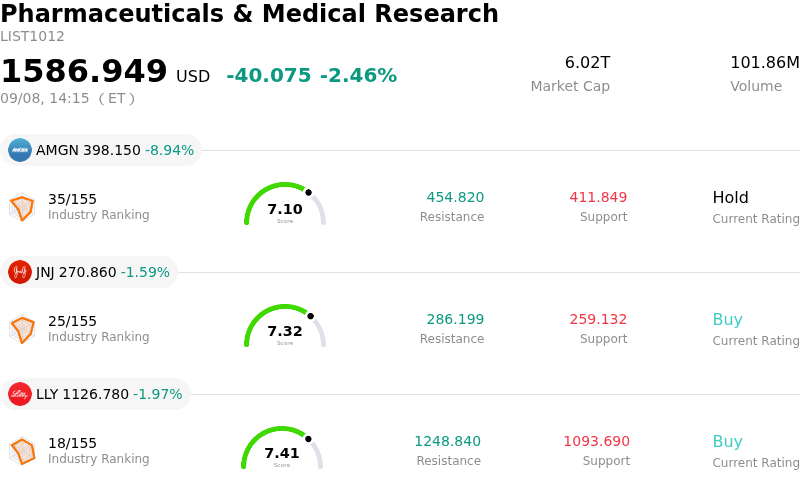
Vertex Pharmaceuticals Inc (VRTX) moved down by 3.06%. The Pharmaceuticals & Medical Research sector is down by 2.46%. The company underperformed the industry. Top 3 stocks by turnover in the sector: Amgen Inc (AMGN) down 8.94%; Johnson & Johnson (JNJ) down 1.59%; Eli Lilly and Co (LLY) down 1.97%.
What is driving Vertex Pharmaceuticals Inc (VRTX)’s stock price down today?
Vertex Pharmaceuticals experienced downward pressure and heightened intraday volatility as market participants engaged in profit-taking following a strong multi-week rally that carried the stock near its 52-week high. Investor sentiment was influenced by a confluence of company-specific integration updates and broader portfolio rebalancing across the mega-cap biotechnology sector.
A central focus for institutional investors remains the recent completion of the multi-billion-dollar acquisition of Crinetics Pharmaceuticals. While the transaction strategically establishes endocrinology as a core commercial growth platform alongside cystic fibrosis, hematology, and pain, market digestion has pivoted toward near-term financial impacts. Because the transaction is not expected to become accretive to non-GAAP operating income until 2029, concerns regarding integration expenses and capital allocation have introduced temporary caution ahead of full financial disclosures slated for the third-quarter earnings call. Furthermore, executive leadership transitions tied to the integration process have prompted short-term institutional recalibration as investors assess operational execution.
Positioning ahead of major industry events also contributed to intraday fluctuations. With executive management scheduled to participate in a series of high-profile healthcare investor conferences throughout September, traders are adjusting positions while awaiting updates on commercial expansion, new product launches, and upcoming regulatory catalysts. Overall, the pullback reflects normal consolidation following an extended upward trend rather than a shift in long-term fundamentals, as Vertex continues to progress its strategy of diversifying beyond its dominant cystic fibrosis franchise.
Technical Analysis of Vertex Pharmaceuticals Inc (VRTX)
Technically, Vertex Pharmaceuticals Inc (VRTX) shows a MACD (12,26,9) value of -4.678, indicating a neutral signal. The RSI at 50.147 suggests neutral condition and the Williams %R at 81.944 suggests oversold condition. Please monitor closely.
Fundamental Analysis of Vertex Pharmaceuticals Inc (VRTX)
Vertex Pharmaceuticals Inc (VRTX) is in the Pharmaceuticals & Medical Research industry. Its latest annual revenue is $12.00B, ranking 21 in the industry. The net profit is $3.95B, ranking 16 in the industry. Company Profile
Over the past month, multiple analysts have rated the company as Buy, with an average price target of $569.66, a high of $672.00, and a low of $350.00.
More details about Vertex Pharmaceuticals Inc (VRTX)
Company Specific Risks:
- Acquisition Accounting and IPR&D Charge Drag: Following the September 1, 2026 closing of the $10 billion Crinetics Pharmaceuticals acquisition, analyst reports highlight an estimated $8.8 billion In-Process Research and Development (IPR&D) charge in Q3 2026, presenting a significant near-term drag on GAAP operating margins and earnings.
- Executive Transition and Integration Execution Risks: The complex post-buyout integration of Crinetics has forced structural leadership shifts, with CFO Charles Wagner expanding into a COO role and Jonathan Poole named incoming CFO, introducing potential operational distraction and execution risk across newly acquired endocrine programs.
- Elevated Valuation Multiple and Limited Upside Buffer: Trading at a P/E ratio of approximately 32x—nearly double the broader U.S. Biotech industry average of 17.1x—and lingering near consensus analyst price targets ($558–$569), the stock faces heightened downside sensitivity to any deceleration in growth or clinical trial delays.
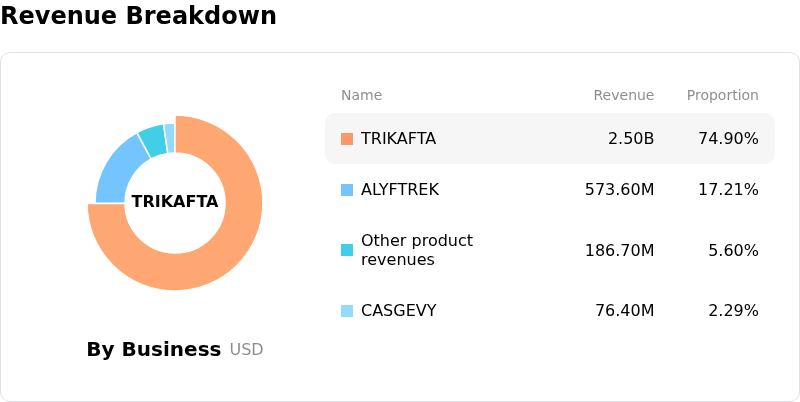
- Over-Concentration in Cystic Fibrosis Franchise: The business model remains overwhelmingly reliant on its core Cystic Fibrosis (CF) drugs for revenue, leaving financial performance exposed while commercial scaling for novel non-CF therapies (such as Casgevy and Journavx) faces complex treatment center logistics and high operational expenses.
Recommended Articles


