


Prediction: This Overlooked International ETF Will Outperform the S&P 500 Over the Next 20 Years
Key Points
Vanguard’s forecasting model expects global stocks to outperform U.S. stocks for the next few decades -- perhaps by 1.2% to 2.2% per year.
The Vanguard Total International Stock ETF holds more than 8,000 global stocks and is trading at a 22% discount to the S&P 500.
- 10 stocks we like better than Vanguard Total International Stock ETF ›
The U.S. stock market has been doing so well for so long that many Americans assume that they only need to buy stocks in American companies. That might be a big mistake. According to Vanguard's latest research as of June 30, international stocks outside the U.S. (unhedged) are expected to outperform U.S. stocks for the next 30 years.
Over this long-term time frame, the Vanguard Capital Markets Model® expects global stocks to deliver annualized returns of 5.9% to 7.9%. That is 1.2% to 2.2% higher per year than the model's expected average annual return for U.S. stocks in the next 30 years: 4.7% to 6.7%.
Missed Nvidia in 2009? This Rare Signal Is Flashing Again. In 2009, a "Double Down" signal flashed for a little-known chipmaker called Nvidia. For the first time in years, that same "Total Conviction" signal is flashing for a company 1/100th the size of Nvidia. Continue »
There's no guarantee that Vanguard's estimate is correct. But if you agree with the general direction of Vanguard's forecast, the Vanguard Total International Stock ETF (NASDAQ: VXUS) could be a good buy today. This international ETF has delivered a total return of 26.7% over the past year, outperforming America's large-cap S&P 500 index (SNPINDEX: ^GSPC).
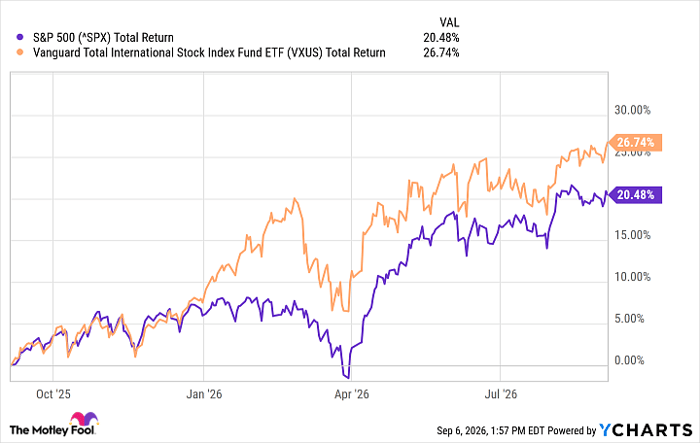
^SPX data by YCharts
Let's look at why this overlooked international ETF might keep beating the S&P 500 for the next 20 years (or longer).

Image source: Getty Images.
Why buy international stocks?
Some investors worry that the S&P 500 is too expensive, after getting top-heavy with tech majors and highly valued artificial intelligence (AI) stocks. Vanguard's research suggests that in the future, the biggest returns from the AI boom might not go only to AI stocks (which are mostly American-based tech companies). Instead, the biggest AI benefits over the next 20 years could go to a wider range of companies and industries that adopt and implement AI to improve their business operations.
That means international companies, even if they were not the first developers or earliest adopters of AI, might be poised to earn some of the biggest future gains in AI productivity and profits. The Vanguard Total International Stock ETF holds many of these companies.
Why buy VXUS: More than 8,000 global stocks, cheaper than the S&P 500
The Vanguard Total International Stock ETF portfolio holds 8,772 stocks from dozens of countries outside the U.S. market. Its trailing 12-month price-to-earnings (P/E) ratio is 18.44, which is a 22% discount to the S&P 500 index's multiple of 23.61. VXUS has also paid a strong trailing 12-month dividend yield of 2.51%, while the S&P 500 yield is at historic lows.
For the past 15 years, since the fund's inception in January 2011, VXUS has delivered average annual returns (by net asset value) of only 6.74%. That's significant underperformance relative to the S&P 500's long-term average return of 10% annualized. But VXUS has done much better in recent years, with 9.17% annualized returns over the past five years, and has strongly outperformed the S&P 500 over the past year.
And based on Vanguard's research and recent trends, the next 20 years might be much better for international stocks. If you're a long-term investor and believe that the rest of the world might be some of the biggest winners from the future of the global economy in the AI era, VXUS could be a good buy. This international stock ETF looks cheap relative to U.S. stocks and could have strong potential to continue growing for years to come.
Should you buy stock in Vanguard Total International Stock ETF right now?
Before you buy stock in Vanguard Total International Stock ETF, consider this:
The Motley Fool Stock Advisor analyst team just identified what they believe are the 10 best stocks for investors to buy now… and Vanguard Total International Stock ETF wasn’t one of them. The 10 stocks that made the cut could produce monster returns in the coming years.
Consider when Netflix made this list on December 17, 2004... if you invested $1,000 at the time of our recommendation, you’d have $421,997!* Or when Nvidia made this list on April 15, 2005... if you invested $1,000 at the time of our recommendation, you’d have $1,413,876!*
Now, it’s worth noting Stock Advisor’s total average return is 978% — a market-crushing outperformance compared to 213% for the S&P 500. Don't miss the latest top 10 list, available with Stock Advisor, and join an investing community built by individual investors for individual investors.
See the 10 stocks »
*Stock Advisor returns as of September 8, 2026.
Ben Gran has positions in Vanguard Total International Stock ETF. The Motley Fool has no position in any of the stocks mentioned. The Motley Fool has a disclosure policy.
Recommended Articles


