


How to Learn Gold Trading for Beginners: Master XAUUSD Charts, Market Sessions, and Smart Strategies

Do you want to enter the world of gold trading but don't know where to start?
In this guide, you will learn the basics of gold trading for beginners—from investment and trading methods, factors affecting gold prices, and market hours, to reading the XAUUSD chart and using risk management tools before opening any real trade. Start your gold trading journey now !
What is gold trading and gold investing?
Gold trading aims to benefit from price movements over hours, days, or weeks. A trader analyzes whether gold may rise or fall, opens a position through an instrument such as XAUUSD CFDs or futures, and manages the trade with a defined stop loss and profit target.
Gold investing usually means holding exposure for years through bullion, coins, gold-backed ETFs, or selected mining stocks. The objective is commonly wealth preservation or portfolio diversification rather than capturing every short-term movement.
Put simply, an investor considers whether gold will maintain purchasing power over years, whereas a trader focuses on short-term price fluctuations over hours or days. Consequently, active gold trading demands close attention to economic indicators, currency dynamics, and interest rates, alongside thorough practice prior to trading with real funds.
Is Gold a Good Investment?
Yes, gold is widely considered a strategic long-term asset that can support portfolio diversification, liquidity, and wealth preservation. Although prices may fluctuate in the short term, gold has historically maintained its value and appreciated over time.
Its investment value is based on four main characteristics:
✅Scarcity: Gold has a limited supply and cannot be created in the same way as fiat currency. Mine production also increases slowly, helping gold maintain its value as demand grows over time.
✅Long-term inflation protection: Gold has historically helped preserve purchasing power during long periods of inflation and currency depreciation. This makes it attractive to investors seeking protection against the declining real value of money.
✅Safe-haven demand: During geopolitical tensions, financial instability, or declining confidence in traditional assets, investors often turn to gold as a safe-haven asset. This demand can support gold prices during uncertain market conditions.
✅Diversification: Gold often behaves differently from stocks and bonds. Adding a measured gold allocation to a portfolio can therefore reduce concentration and improve resilience when other asset classes are under pressure.
Gold does not generate interest or dividends, and its price may fluctuate over shorter periods. However, it remains a great long-term investment option because it can preserve wealth and help protect a portfolio from declines in other assets.
Know About the Gold Market Open Time
Knowing when the gold market is most active can help beginners choose better trading times instead of entering randomly. Gold does not move with the same strength throughout the day, so understanding quieter and more active sessions can make market conditions easier to assess before opening a trade.
What Is the Best Time to Trade Gold?
The European–US overlap is often considered the most active time to trade gold because both markets are open and major US data, such as inflation and employment reports, may be released. This period usually offers higher liquidity and clearer price movement, approximately from 16:00 to 19:00 in Egypt and Saudi Arabia and 17:00 to 20:00 in the UAE.
What Moves the Price of Gold?
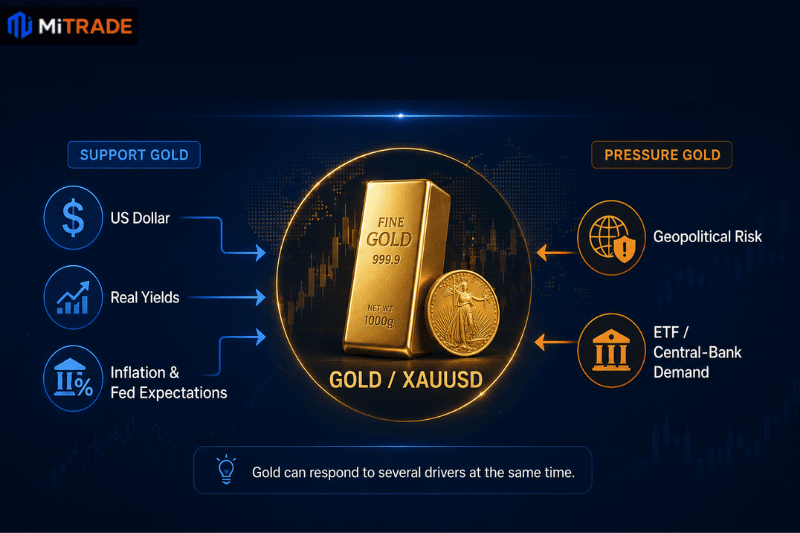
Gold prices are influenced by the US dollar, real yields, monetary policy, geopolitical risk, and market demand. Beginners should assess how these factors interact rather than relying on a single headline.
1 Supply and Demand
Gold prices are influenced by supply and demand. Demand comes from jewelry, investment, ETFs, and central-bank purchases, while supply comes from mine production and recycled gold. Strong demand or limited supply can support prices, whereas weaker demand or increased selling pressure can weigh on gold.
2 The US Dollar
Gold is priced in US dollars, so the two assets are often strongly inversely correlated. A stronger dollar usually pressures XAUUSD by making gold more expensive for foreign buyers, while a weaker dollar often supports gold prices.
3 Interest Rates and Real Yields
Gold pays no interest, making it less attractive when inflation-adjusted bond yields rise. Falling real yields can support demand by reducing the opportunity cost of holding gold.
4 Inflation and Monetary Policy Expectations
Inflation can influence gold through changes in interest-rate expectations, real yields, and the US dollar. Higher-than-expected inflation may pressure gold when it leads markets to expect tighter monetary policy, while persistent inflation can strengthen gold’s appeal as a long-term store of value.
5 Geopolitical and Financial Risk
Wars, banking stress, and financial instability can increase demand for gold as investors seek safer assets. However, during severe market stress, some investors may temporarily sell gold to raise cash or cover losses elsewhere, which can briefly push its price lower.
Pros and Cons of Trading Gold
Pros of Trading Gold
✅High liquidity: Gold is actively traded across major financial centers, which can support efficient entry and exit during liquid hours.
✅High profit potential: Gold can experience large price fluctuations, creating opportunities for traders to profit from both rising and falling markets
✅Diversification potential: Gold can respond differently from equities and bonds, although correlations change and diversification never guarantees a profit.
✅Suitable for different time horizons: Gold can suit a wide range of market participants, from long-term investors and swing traders to day traders and scalpers, because it can be held over years or traded across medium- and short-term price movements.
Cons of Trading Gold
❌Short-term volatility: Gold can experience sharp price swings, creating a higher risk of slippage and stop-outs, especially for short-term traders using tight stop-loss levels.
❌No dividends: Unlike dividend-paying stocks, gold does not pay dividends, so investors rely on price appreciation to generate returns.
❌Physical gold costs: Buying physical gold may involve dealer premiums, storage, insurance, and resale costs, which can reduce overall returns.
How to Trade and Invest in Gold?
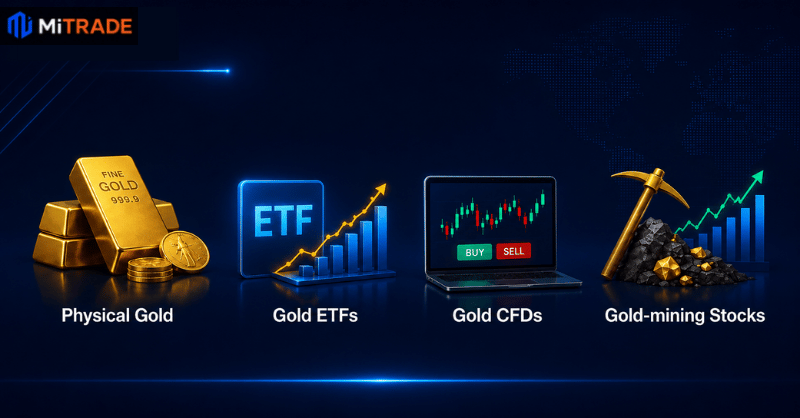
Gold can be accessed through physical bullion, ETFs, CFDs, and mining stocks. Each method differs in cost, risk, flexibility, and suitability for long-term investing or active trading.
1. Physical Gold
Physical gold (such as bars and coins) provides direct, tangible ownership of the metal. Investors must consider purity, certification, dealer premiums, secure storage, insurance, and resale value.
Best Suited To: Long-term investors who prioritize physical ownership and wealth preservation and are willing to accept storage costs and lower liquidity.
Where to Invest: Banks, authorized bullion dealers, trusted local gold shops, and reputable online bullion platforms.
2. Gold ETFs
Gold Exchange-Traded Funds (ETFs) track the spot price of gold, giving investors market exposure without requiring physical storage. Factors to consider include expense ratios, liquidity, tracking differences, and physical backing.
Best Suited To: Investors seeking liquid, hassle-free, long-term gold exposure directly through traditional stock markets.
Where to Invest: Stock exchanges accessible via online brokers or investment platforms that list gold ETFs.
3. Gold CFDs
A Gold CFD (Contract for Difference) allows traders to speculate on XAUUSD price movements in both directions (Buy or Sell) without taking ownership of physical gold. It provides flexible leverage, zero-commission trading, and high capital efficiency.
Best Suited To: Active short-term traders and beginners seeking flexible two-way price exposure, competitive transaction costs, and lower initial capital requirements.
Where to Trade: Regulated online trading platforms like Mitrade, which offers zero commission, tight floating spreads on XAUUSD, flexible leverage, negative balance protection, and a free $50,000 demo account to practice trading risk-free.
Experience Gold CFD Trading Now
Get $50,000 in free demo funds instantly!
🎁 Claim up to $100 cash bonus!
4. Gold-Mining Stocks
Gold-mining stocks represent equity ownership in companies that explore and produce gold. Returns depend on operational costs, reserves, debt, and management decisions—meaning stock prices can sometimes move independently of gold prices.
Best Suited To: Investors seeking indirect exposure to the gold industry along with the potential for equity growth and dividend income.
Where to Invest: Major stock exchanges through traditional online brokerage accounts that provide access to listed mining companies.
Before choosing how to invest in gold, ask yourself first: What is your primary investment goal?
If your goal is long-term wealth preservation, buying physical gold or investing in Gold ETFs may be the right choice.
If you are looking for greater flexibility and want to profit from both rising and falling price movements, trading gold via CFDs might be more suitable—provided you learn the fundamentals and strictly use risk management tools like stop-loss and take-profit orders.
If minimizing costs is your top priority, Gold CFDs or Gold ETFs are often more efficient than buying physical gold. CFDs hold a clear advantage in terms of trading costs, frequently offering zero-commission trading and tight spreads, making them especially suitable for active traders who execute frequent positions.
How to Read the Gold Chart?
Start with what XAUUSD represents, how candlesticks record price, and where buyers and sellers repeatedly react. These concepts help beginners plan entries, stop-loss levels, and profit targets.
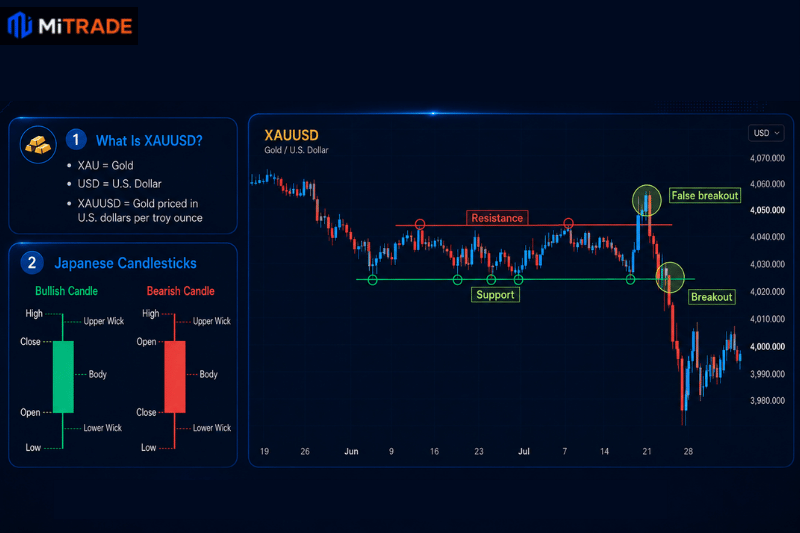
Step 1: Understanding the Global Gold Symbol XAUUSD
XAU is the market code for gold, while USD represents the US dollar. XAUUSD shows the price of one troy ounce of investment-grade gold in US dollars, and one troy ounce equals approximately 31.1035 grams.
When the price of XAUUSD rises, it means gold has become more expensive against the dollar, and when it falls, it means the price of gold has declined against the dollar.
It is important to know that gold is heavily influenced by the movement of the US dollar. If the dollar rises strongly, it can put downward pressure on gold, whereas if the dollar weakens, gold may become more attractive to investors and traders.
Step 2: Reading Japanese Candlesticks for Gold
A candlestick’s body and wicks reflect the battle between buyers and sellers, while its size, pattern, and location provide important context.
A green bullish candle forms when gold closes above its opening price, showing that buyers were stronger than sellers. A larger green body generally indicates stronger buying momentum.
A red bearish candle forms when gold closes below its opening price, showing that sellers were stronger than buyers. A larger red body generally indicates stronger selling momentum.
Open: The price at which the candle begins.
Close: The price at which the candle ends.
High: The highest price reached during the period.
Low: The lowest price reached during the period.
★ Each candle represents a selected timeframe: a one-hour candle forms over one hour, while a daily candle forms over approximately 24 hours. A candle forming at an important support or resistance level is generally more significant than the same candle forming in the middle of a range. Higher-timeframe candles also tend to provide more reliable signals than lower-timeframe candles.
Step 3: Identifying Key Support and Resistance Levels
Support and resistance levels are among the most essential tools that help traders identify potential areas where price may pause or reverse direction.
Support is a level where repeated buying has slowed or reversed a decline, while resistance is where repeated selling has capped an advance.
For example, if you notice that gold drops to a specific zone multiple times and then rebounds upward, this area may act as support. Conversely, if gold rises to a specific level several times and then pulls back, this area may act as resistance.
However, it is important for traders not to view support and resistance as exact, fixed numbers, but rather as approximate zones. Therefore, it is best to wait for confirmation from price action or Japanese candlestick patterns before opening any trade, rather than entering simply because the price reached a support or resistance level.
How to Start XAUUSD Trading as a Beginner?
Once you understand what the XAUUSD symbol means and how to read basic chart patterns, you are ready to take your first practical steps on Mitrade.
However, when you're just starting out with gold trading, it isn't wise to jump straight in with real money. Instead, the smartest approach is to build confidence on a demo account first, learning how to open and manage trades risk-free.
Step 1: Start with a Demo Account
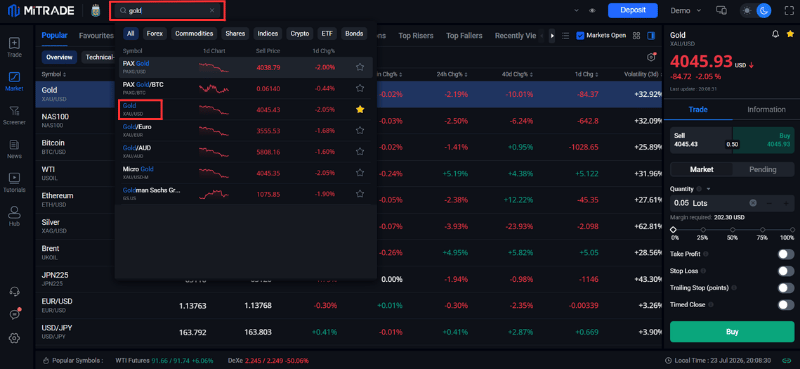
Before risking real capital, open a free Mitrade demo account. It takes just a few minutes, requires no deposit, and gives you $50,000 in virtual funds.
Use this space to get comfortable with the platform: search for Gold or XAUUSD, open the live chart, and practice entering, adjusting, and closing positions. Treat this demo account like real money so you build disciplined habits from day one.
Step 2: Analyze the Market & Set Your Parameters
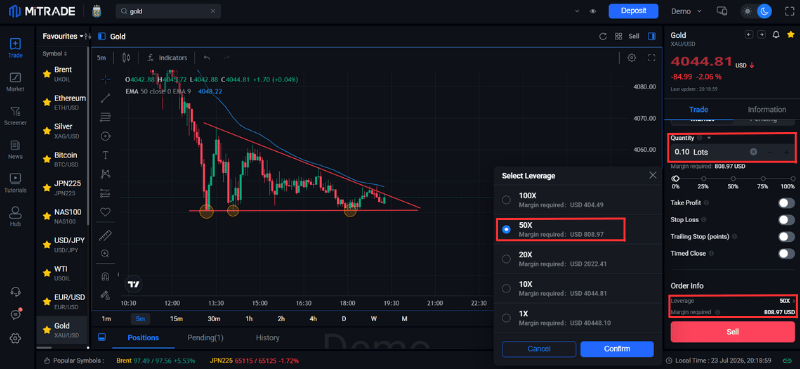
Before placing any trade, take a moment to evaluate the market. Look for basic trendlines, support and resistance zones, or simple indicators like moving averages to spot potential entry points. Keep an eye on the economic calendar too—major US data releases like inflation or employment figures can move gold quickly.
When setting your position parameters, keep these rules in mind: 🔹Start small: Stick to smaller sizes like 0.01 to 0.05 lots. 🔹Match lot size to risk: Choose a lot size based on your account balance and stop-loss distance. 🔹Be cautious with leverage: High leverage amplifies both gains and losses. 🔹Keep the risk within 1% per trade: If you plan to start with a $1,000 real deposit later and want to risk only 1% ($10) per trade, practice on your demo account using that exact same $1,000 mindset. |
Step 3: Execute Your Trade with Risk Controls
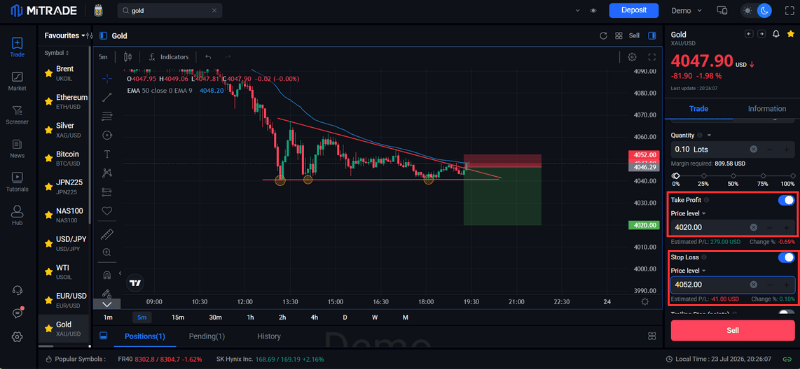
Decide on your market direction. Select Buy if your analysis suggests gold may rise, or Sell if you expect it to fall.
Before hitting confirm, double-check your position size, entry price, and capital-protection tools:
Stop Loss (SL): Automatically closes your trade if the market moves against you, capping your potential loss.
Take Profit (TP): Automatically locks in your gain when gold reaches your target price.
Step 4: Transition Smoothly to a Live Account
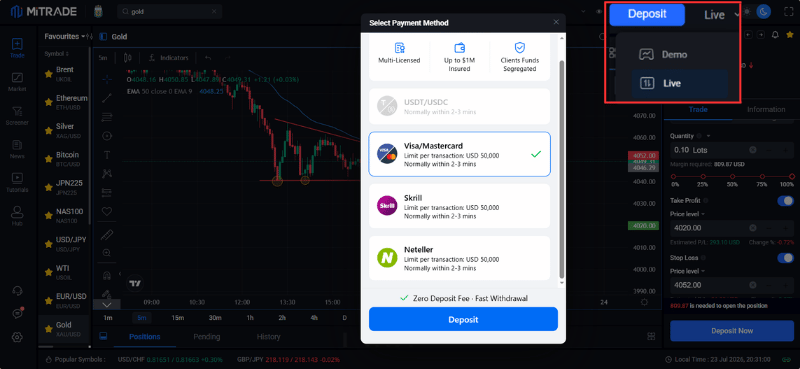
Only move to a live account once you are comfortable navigating the platform, executing your strategy, and managing risk consistently.
Mitrade allows you to start live trading with a small minimum deposit starting at $50. As a beginner, it is best to start small with money you can comfortably afford to risk while you gain real market experience.


The Recommended Strategies for Beginners
There is no single gold trading strategy that fits all traders. Beginners should choose a method that matches their goals, experience, and preferred market conditions. The following five strategies explain how to identify and apply common gold trading setups step by step.
Strategy 1: Gold-Silver Ratio Strategy
This strategy compares the price of gold with silver to identify which metal may be relatively expensive or undervalued. The ratio is mainly used as a relative-value tool rather than as a direct entry signal.
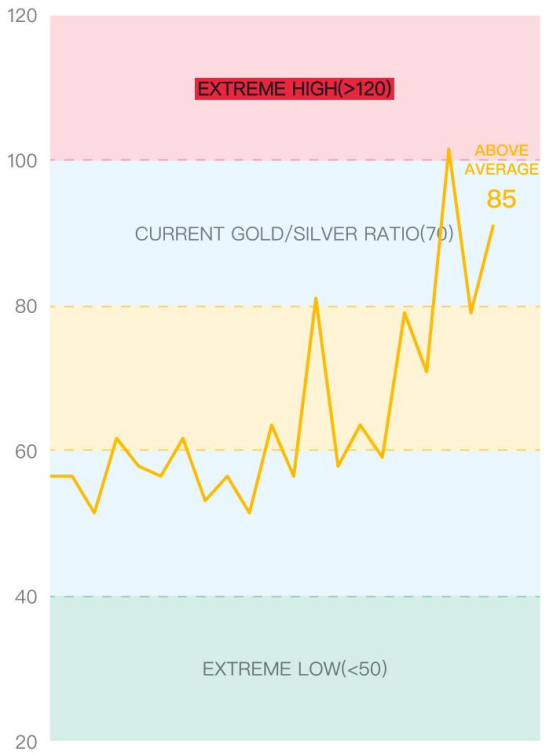
❶ Calculate the Current Gold-Silver Ratio: Calculate the ratio by dividing the price of one ounce of gold by the price of one ounce of silver. For example, if gold is priced at $4,000 and silver is at $70, the ratio equals approximately 57.1—meaning one ounce of gold is worth about 57 ounces of silver.
❷ Compare the Ratio to Key Market Levels: Once you calculate the ratio, compare it against key historical reference levels, such as 60 and 80:
Above 80: Suggests that gold may be relatively expensive compared to silver (or silver is undervalued).
Below 60: Suggests that silver may be relatively expensive compared to gold, or that gold is relatively undervalued.
❸ Identify Potential Trade Setups: In the example above, the ratio is 57.1, which falls below the 60 level. This might lead a trader to consider buying gold or selling silver, as gold appears relatively undervalued compared to silver.
But never rely on this ratio alone. Always confirm your decision using broader price trends, key support and resistance zones, and candlestick patterns before opening any trade.
Strategy 2: Moving Average Crossover Strategy
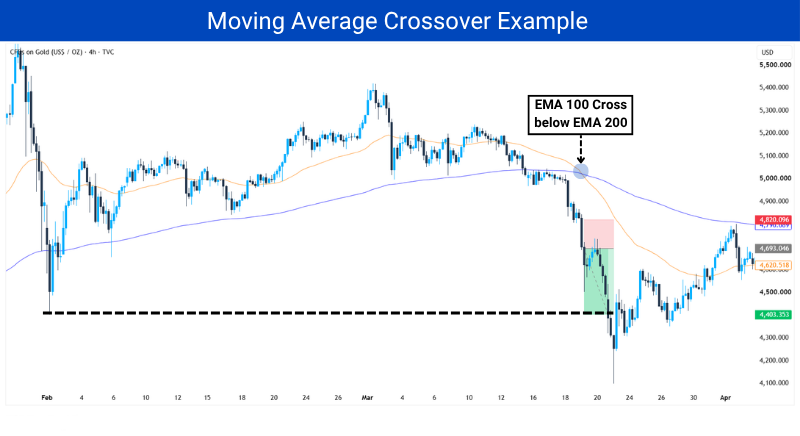
This strategy uses two moving averages to identify possible changes in gold’s trend. When the faster average crosses the slower one, it may signal that market momentum is shifting.
❶ Add two moving averages: Select a faster and a slower moving average. In the chart, the strategy uses the EMA 100 and EMA 200.
❷ Identify the crossover: A cross above the slower EMA may indicate a bullish shift, while a cross below it may indicate a bearish shift. In the example, the EMA 100 crosses below the EMA 200.
❸ Confirm the entry: Wait for a weak retest, bearish confirmation candle, or resistance rejection before selling. The stop loss can be placed beyond the retest, while the previous low may be used as the target.
Strategy 3: Overbought and Oversold Strategy
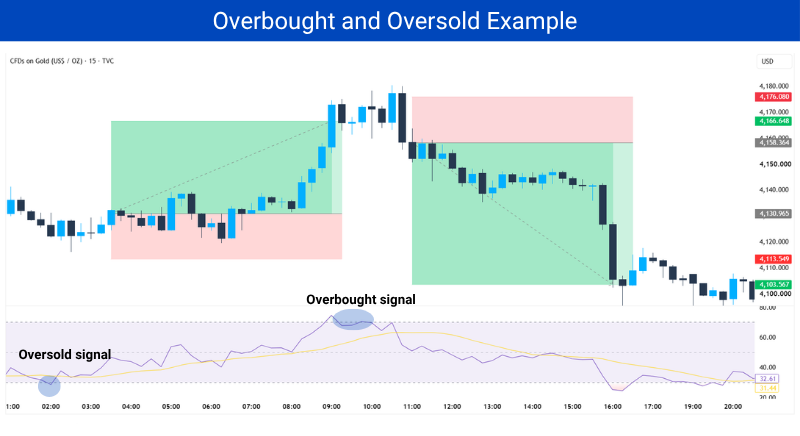
This strategy uses momentum indicators such as RSI, Stochastic RSI, the Stochastic Oscillator or Williams %R to identify overbought and oversold conditions. On RSI, readings above 70 suggest overbought conditions, while readings below 30 suggest oversold conditions. However, these indicators alone do not confirm a reversal.
❶ Add RSI: Use the common 14-period setting. Readings above 70 indicate overbought conditions, while readings below 30 indicate oversold conditions.
❷ Watch for the signal: An overbought reading may suggest a possible pullback, while an oversold reading may suggest a possible rebound. However, RSI alone does not confirm a reversal.
❸ Wait for price confirmation: In the chart, the buy setup appears when RSI recovers from oversold territory with bullish candlestick confirmation. The sell setup appears when RSI falls from overbought territory with bearish confirmation. Support and resistance levels or divergence may provide additional confirmation.
Strategy 4: Support and Resistance Strategy
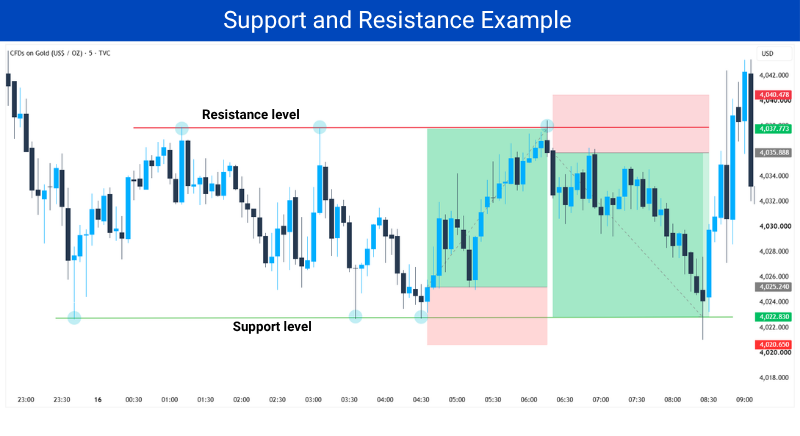
This is one of the simplest strategies for beginners because it focuses on price levels where gold has reacted several times. Support is a level where buying pressure may appear, while resistance is a level where selling pressure may emerge.
❶ Identify the levels:Look for areas where gold previously made a significant move. For support, mark the lowest point from which a strong bullish move began. For resistance, mark the highest point from which a strong bearish move began.
Previous highs, lows, and round numbers can help identify important support and resistance levels.
❷ Wait for a reaction: Near support, look for a bullish rejection or a higher close before considering a buy. Near resistance, look for a bearish rejection or a lower close before considering a sell.
❸ Plan the trade: In the chart, a buy setup appears after price rejects support, while a sell setup appears after rejection from resistance. Place the stop loss beyond the rejection level and use the opposite level as a possible target. For breakouts, wait for a close beyond the level and a successful retest.
Strategy 5: News and Economic-Data Strategy
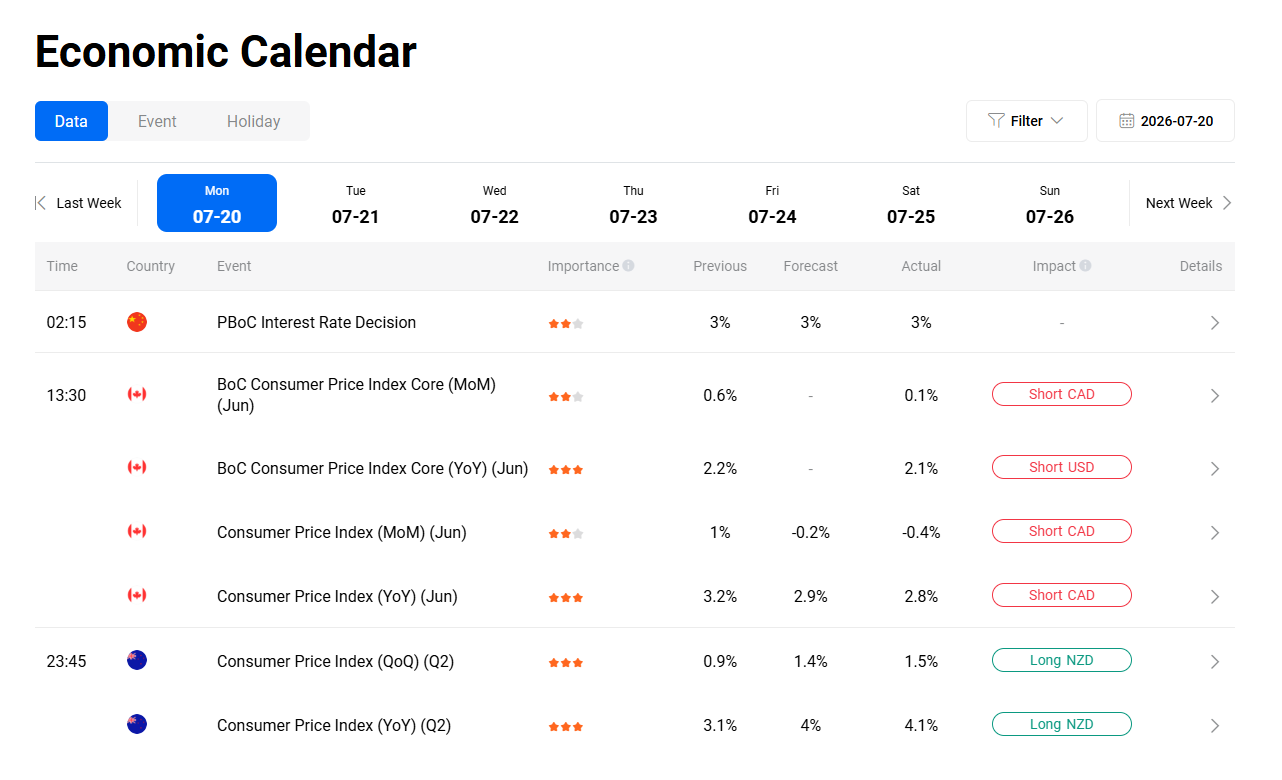
This strategy can be used directly by fundamental traders, while technical traders can use economic releases as supporting context and additional confirmation for chart-based setups. You can Check the Mitrade economic calendar before every session and note upcoming CPI, PCE, NFP, and FOMC events.
❶ Check the calendar: Review high-importance events such as CPI, PCE, NFP, and FOMC decisions, preferably before the trading session begins.
❷ Compare the result: Examine the actual figure against the forecast and previous reading. Then observe whether the dollar and US yields confirm or contradict gold’s initial move.
❸ Wait before entering: Avoid trading immediately after the release. Wait for the first 15- or 30-minute candle to close, then look for a confirmed breakout and retest. Use a smaller position size, place the stop beyond the post-news consolidation, and target the next support or resistance level.
▲ Conclude in one sentence: No strategy guarantees a profit. Beginners should test one setup over multiple trades, use a small predefined risk, and avoid trading when market conditions do not match the strategy. For example, using a trend-following strategy in a ranging market or a range-trading strategy during a strong trend.
Important Economic Events to Watch When Trading Gold
Three major US events deserve particular attention when trading gold: inflation reports such as CPI and PCE, the NFP employment report, and Federal Reserve meetings. Each can quickly affect interest-rate expectations, Treasury yields, the US dollar, and therefore XAUUSD.
1. US Inflation Data: CPI and PCE
CPI tracks changes in consumer prices, while PCE covers a broader range of consumer spending and reflects changes in purchasing behaviour. Core PCE is also closely watched by the Federal Reserve when assessing underlying inflation.
These reports are important because inflation can change expectations for future interest rates:
Higher-than-expected inflation: May support higher rates, Treasury yields and the dollar, which can pressure gold.
Lower-than-expected inflation: May support rate-cut expectations and gold.
Mixed headline and core readings: May cause an uncertain or volatile reaction.
CPI is generally released monthly at 8:30 a.m. Eastern Time. Traders should check both headline and core inflation before making a decision.
2. Nonfarm Payrolls (NFP)
NFP is part of the monthly US Employment Situation report and shows the change in nonfarm payroll employment. Traders should also check unemployment, wage growth and revisions to previous results.
The report matters because labour-market strength can influence Federal Reserve policy expectations:
Strong employment and wage growth: May support higher rates and the dollar, pressuring gold.
Weak employment data: May increase rate-cut expectations and support gold.
Conflicting figures: May cause gold to move sharply in both directions.
Beginners may prefer to wait until the first reaction settles when payrolls, unemployment and wages send different signals.
3. Federal Reserve Meetings (FOMC)
The FOMC reviews economic conditions and determines the appropriate stance of US monetary policy. Traders follow the rate decision, policy statement, economic projections and the Fed Chair’s press conference.
FOMC meetings are important because they directly influence expectations for US interest rates:
Higher-for-longer signals: May lift yields and pressure gold.
Signals of future rate cuts: May support gold.
Unexpected guidance: Can create sharp volatility and reversals.
The FOMC normally holds eight scheduled meetings each year. Beginners can reduce their trade size or wait until volatility becomes calmer.
The Mitrade economic calendar allows traders to filter events by date, country and importance. It also shows previous, forecast and actual results, helping traders prepare before major announcements.
Conclusion
Learning gold trading takes time, but beginners do not need to master everything at once. Start with one simple strategy, practise on a demo account, and use clear support and resistance levels to plan entries, targets and stop-loss levels.
Use Mitrade’s demo account to practise trading XAUUSD with virtual funds, test your strategy and become familiar with the platform before risking real money. With regular practice, controlled risk and a clear process, beginners can gradually improve their gold-trading skills.
Risk-Free Demo Account
CMA-regulated | 24х5 | T+0 | low spreads. Enjoy limit and stop loss for every trade!
* The content presented above, whether from a third party or not, is considered as general advice only. This article should not be construed as containing investment advice, investment recommendations, an offer of or solicitation for any transactions in financial instruments.


