December Santa Claus Rally: New highs in sight for US and European stocks?

coverImg
Source: DepositPhotos

One week into December, markets are expecting the Santa Claus Rally.

The so-called Santa Claus Rally refers to the sustained uptrend found during the last five trading days of December and the first two trading days of January. Historical data show that U.S. stocks tend to rise during this period. Increasingly, the term is now also generally used to refer to the seasonal rise in U.S. shares in December.

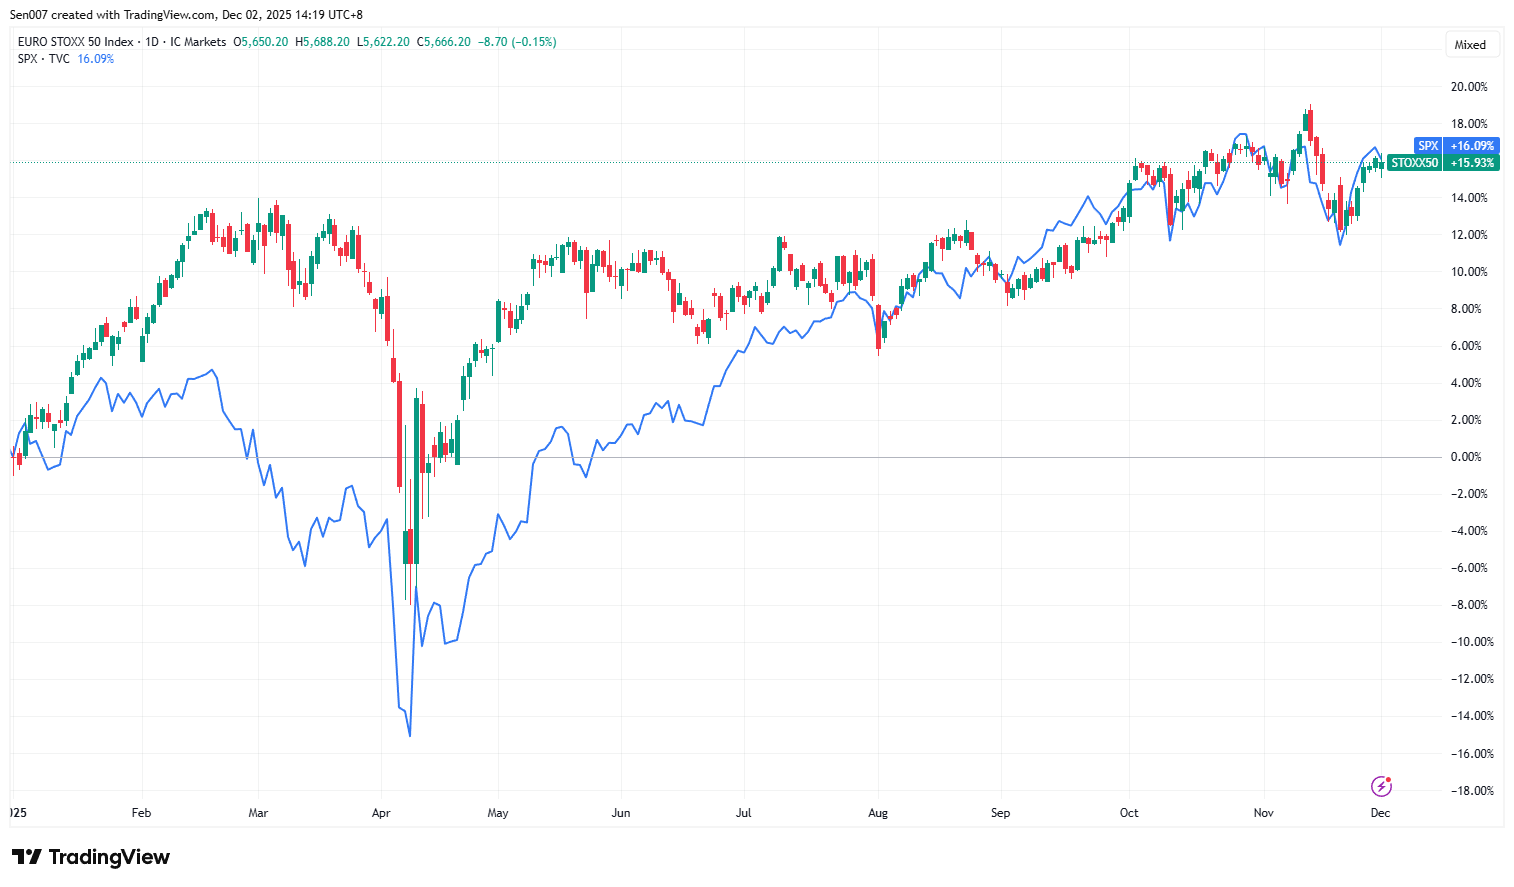
In 74% of the time over the past 40 years, the S&P 500 Index rose in December, with an average monthly return of 1.44%, second only to November.

This seasonal uplift extends across the Atlantic as well, with European indices sometimes even outperforming their U.S. counterparts.

Since its inception in 1987, the Euro Stoxx 50—the benchmark index for Eurozone blue-chip stocks—has delivered an average December gain of 1.87%, just behind its 1.95% average for November, making December the second-best-performing month of the year.

"Even more striking is the probability of gains — the index has ended December higher 71% of the time, far surpassing other months.
17659396392641

[Source: TradingView; 2025 EURO STOXX 50, S&P 500]

What causes the Santa Claus Rally?

Seasonax analyst Christoph Geyer believes this upward rally is closely tied to institutional investor behavior. As the year draws to a close, fund managers would make final portfolio adjustments to lock in performance and present the results to clients and shareholders.

Such “window dressing” activity often leads to increased buying pressure, particularly in stocks that have already shown strong performance or stand to benefit from short-term momentum.

Other analysts point to the broader psychological impact of Christmastide: festive sentiment tends to lift investor optimism, while heightened risk appetite provides further tailwinds for equity markets.

Will 2025 see a Santa Claus rally?

Analysts are divided on whether the Santa Claus rally will arrive on schedule this year.

Amy Wu Silverman, Head of Derivatives Strategy at RBC Capital Markets, argues that the Santa Claus Rally might not appear this year, noting that U.S. equity performance so far in 2025 has largely defied seasonal norms.

In contrast, Tom Lee, co-founder of Fundstrat Global Advisors, is optimistic. He contends that with the Federal Reserve poised to cut rates this month — and quantitative tightening set to conclude after nearly three years — liquidity conditions are primed for a dramatic surge. He believes the S&P 500 is positioned for a year-end melt-up.

If December turns strong, Tome Lee expects an aggressive, catch-up buying from fund managers to avoid underperformance.

Read more

  • Spot Gold Breaches Four Key Levels, Putting $3,500 at Risk as Technicals Enter Oversold Alert Zone
  • Note: If you want to share the article 《December Santa Claus Rally: New highs in sight for US and European stocks?》, make sure you retain the original link. For more information, please visit Insights or browse www.mitrade.com.


    Before making any trading decisions, it is important to equip yourself with sufficient fundamental knowledge, have a comprehensive understanding of market trends, be aware of risks and hidden costs, carefully consider investment targets, level of experience, risk appetite, and seek professional advice if necessary.


    Furthermore, the content of this article is solely the author's personal opinion and does not necessarily constitute investment advice. The content of this article is for reference purposes only, and readers should not use this article as a basis for any investment decisions.


    Investors should not rely on this information as a substitute for independent judgment or make decisions solely based on this information. It does not constitute any trading activity and does not guarantee any profits in trading.


    If you have any inquiries regarding the data, information, or content related to Mitrade in this article, please contact us via email: insights@mitrade.com. The Mitrade team will carefully review the content to continue improving the quality of the article.


    goTop
    quote
    Related Articles
    placeholder
    TradingKey Daily Market Brief: Three Major US Indexes Drop Over 2%, Anthropic Gains 17% on DebutTracking Market TrendsTradingKey - All three major U.S. stock indices fell more than 2%, with the Nasdaq Composite Index (IXIC) down 2.25% to 23,879.20 points; the Dow Jones Industrial Average (DJIA)
    Author  TradingKey
    Nov 20, Fri
    Tracking Market TrendsTradingKey - All three major U.S. stock indices fell more than 2%, with the Nasdaq Composite Index (IXIC) down 2.25% to 23,879.20 points; the Dow Jones Industrial Average (DJIA)
    placeholder
    Nvidia posts record $115.8B Q3 revenue, but crypto stays mutedThe crypto market remained subdued on Tuesday despite Nvidia's (NVDA) Q3 earnings release beating analysts' expectations as demand for artificial intelligence infrastructure continued to drive growth across its business.
    Author  FXStreet
    Nov 18, Wed
    The crypto market remained subdued on Tuesday despite Nvidia's (NVDA) Q3 earnings release beating analysts' expectations as demand for artificial intelligence infrastructure continued to drive growth across its business.
    placeholder
    Nvidia Q3 Earnings Loom as Market Expects Revenue Near $109 Billion: Can NVDA Stock Hold $150? As of the close on November 16 ET, Nvidia (NVDA) shares fell 4.12% to close at $156.14, with an intraday low of $155.01 and trading volume of about 334 million shares. Compared with its p
    Author  TradingKey
    Nov 17, Tue
    As of the close on November 16 ET, Nvidia (NVDA) shares fell 4.12% to close at $156.14, with an intraday low of $155.01 and trading volume of about 334 million shares. Compared with its p
    placeholder
    Weekly Report: The index rose 2.5% while Nvidia fell 12.7% — two equity divergences, one should closeThe S&P 500 rose 2.51% to 7,561.67 and the QQQ rose 3.63% to 679.89 last week, while Nvidia fell 12.75% to 162.85 — a sixth straight weekly loss and 32% below its October record. In the same five sessions, energy equities rose 5.42% while WTI fell 2.52%. Both pairs normally move together (60-day correlations of +0.64 and +0.58). This report ranks which divergence closes first, with the trigger for each.
    Author  Irene Q.
    Nov 16, Mon
    The S&P 500 rose 2.51% to 7,561.67 and the QQQ rose 3.63% to 679.89 last week, while Nvidia fell 12.75% to 162.85 — a sixth straight weekly loss and 32% below its October record. In the same five sessions, energy equities rose 5.42% while WTI fell 2.52%. Both pairs normally move together (60-day correlations of +0.64 and +0.58). This report ranks which divergence closes first, with the trigger for each.
    placeholder
    Anthropic is six times oversubscribed at $1.4 trillion while Nvidia is down 32% — the AI trade has two pricesAnthropic lists on Nasdaq as ANT on Thursday at $70 ~ $78 a share, raising up to $64.4 billion at a target valuation near $1.4 trillion, and the book is reportedly six times covered. In the same six weeks, Nvidia has fallen 32% and the QQQ is 10.9% below its October peak. Private capital and public markets are marking the same AI complex at two very different prices. This piece separates the two books: what the S-1 shows, who is anchoring the $26 billion private placement, and what Thursday's debut would have to do to change the public tape.
    Author  Irene Q.
    Nov 16, Mon
    Anthropic lists on Nasdaq as ANT on Thursday at $70 ~ $78 a share, raising up to $64.4 billion at a target valuation near $1.4 trillion, and the book is reportedly six times covered. In the same six weeks, Nvidia has fallen 32% and the QQQ is 10.9% below its October peak. Private capital and public markets are marking the same AI complex at two very different prices. This piece separates the two books: what the S-1 shows, who is anchoring the $26 billion private placement, and what Thursday's debut would have to do to change the public tape.
    Live Quotes
    Name / SymbolChart% Change / Price
    NAS100
    NAS100
    0.00%0.00
    US500
    US500
    0.00%0.00
    EU50
    EU50
    0.00%0.00

    US Stocks Related Articles

    • 10 Best Day Trading Platforms for Beginners and Active Traders in 2026: A Practical Guide
    • How To Invest in SpaceX Stock in 2026? Everything Investors Need to Know
    • Practice Trading Us Stocks? These Are 10 Best Stock Trading Demo Apps For Beginners
    • ​5 Best Paper Trading Platforms for 2026 (Free Demo Accounts for Beginners & Traders)
    • Wall Street’s Top 10 US Stocks for 2026 vs What Reddit Is Actually Buying
    • Is Mitrade Right for You? A Complete Guide on How to Start Trading CFDs in 5 Steps

    Click to view more