

Apple Stock Price Forecast: AAPL Continues Pullback After Record High, Will It Test $300 Again This Year?

Source Tradingkey

Apple 2026 Stock Performance Review

TradingKey - 2026 was a landmark year for Apple Inc. (AAPL) marked by milestones and strong stock performance. Driven by on-device AI deployment, robust sales of the iPhone 17 series, and hardware-software ecosystem upgrades, the company's stock price overcame early-year macroeconomic volatility to achieve a strong one-way upward trend during the year, breaking historical records in mid-October and briefly crossing the $5.0 trillion market capitalization mark.

From January to March this year, Apple's stock price mainly fluctuated in a wide range of $240–$280; from April to June, AAPL broke out of the consolidation pattern and surpassed the $300 mark; from July to September, Apple's stock price gains slowed noticeably, but still maintained an upward trajectory and broke above $340; in October, the stock price launched a new rally and hit an all-time high of $348.15 on October 13.
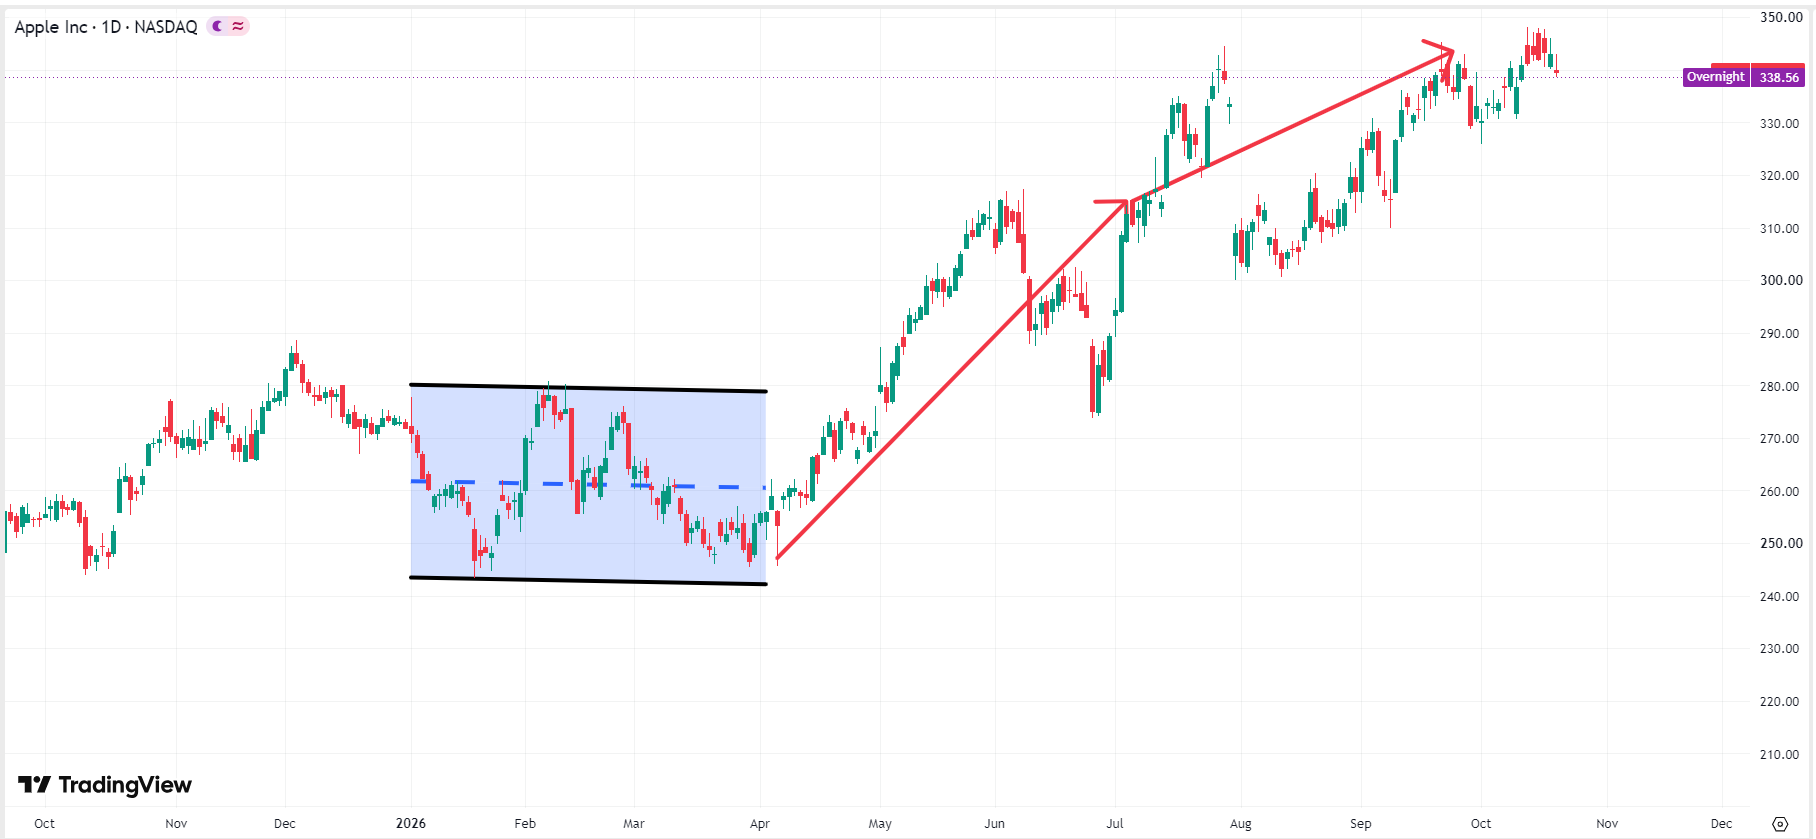
aapl-apple-price-fd8137ece34f462bb8edef8017bd9ce4Apple stock price chart, Source: TradingView

What Factors Affect Apple's Stock Price Volatility?

In early 2026, Apple's stock price maintained high-level volatility, mainly affected by macro inflation shocks and Federal Reserve interest rate decisions. Tech stocks across the market faced short-term deleveraging pressure, and public market capital was closely watching Apple's path to commercial monetization in the on-device AI space.

In the second quarter, Apple's stock price experienced a significant rally, primarily because Q2 earnings far exceeded expectations, combined with management's announcement of a massive $100 billion-level share buyback program that significantly boosted market confidence. Furthermore, at WWDC 2026, Apple demonstrated a new-generation Siri agent deeply integrated with macOS and iOS, as well as a private cloud computing architecture, sparking immense capital market expectations for a hardware supercycle.

Heading into the third quarter, global pre-order figures for the all-new iPhone 17 series exceeded expectations, driving up both the average selling price and hardware gross margin. Moreover, the market viewed Apple Intelligence as an exclusive, closed-loop software and hardware ecosystem, pushing up the valuation premium for the services business.

Will Apple Stock Fall Further This Year?

After surging to an all-time high of $348.15 and briefly crossing the $5 trillion market cap milestone, Apple's stock price has recently continued to pull back below $340. In the short term, affected by macroeconomic headwinds and pre-event wait-and-see sentiment, there remains a risk of a modest downward shakeout.

U.S. September CPI (3.7%) and PPI (MoM +1.3%) came in higher than expected, triggering a sharp rebound in U.S. Treasury yields. In a high-interest-rate environment, high-P/E tech giants across the market generally face deleveraging selling pressure from valuation recalibration, while Apple's current P/E of around 38.9x remains at a relatively high level, meaning downside risks have not yet been cleared.

Apple is about to hold its "Pro and Tell" product launch event on October 28 and report its Q4 financial results on November 2. Ahead of these two major announcements, some short-term profit-takers and quantitative algorithmic funds tend to reduce leverage and lock in gains, unless major positive news emerges to attract capital inflows.

Where Is Apple's Next Line of Defense?

From a technical analysis perspective, if the broader market continues its short-term volatile pullback, Apple's first line of defense lies in the $320–$330 range. This is the midline of its high-level consolidation over the past three months, as well as the cost basis zone where long-term institutional capital and quantitative funds built up concentrated positions ahead of the autumn launch event. If the market weakness is merely a normal deleveraging shakeout driven by a macro jump in U.S. Treasury yields, the stock has a higher probability of finding support and rebounding here. However, if Apple itself encounters negative developments, the stock price may continue downward to search for another line of defense.
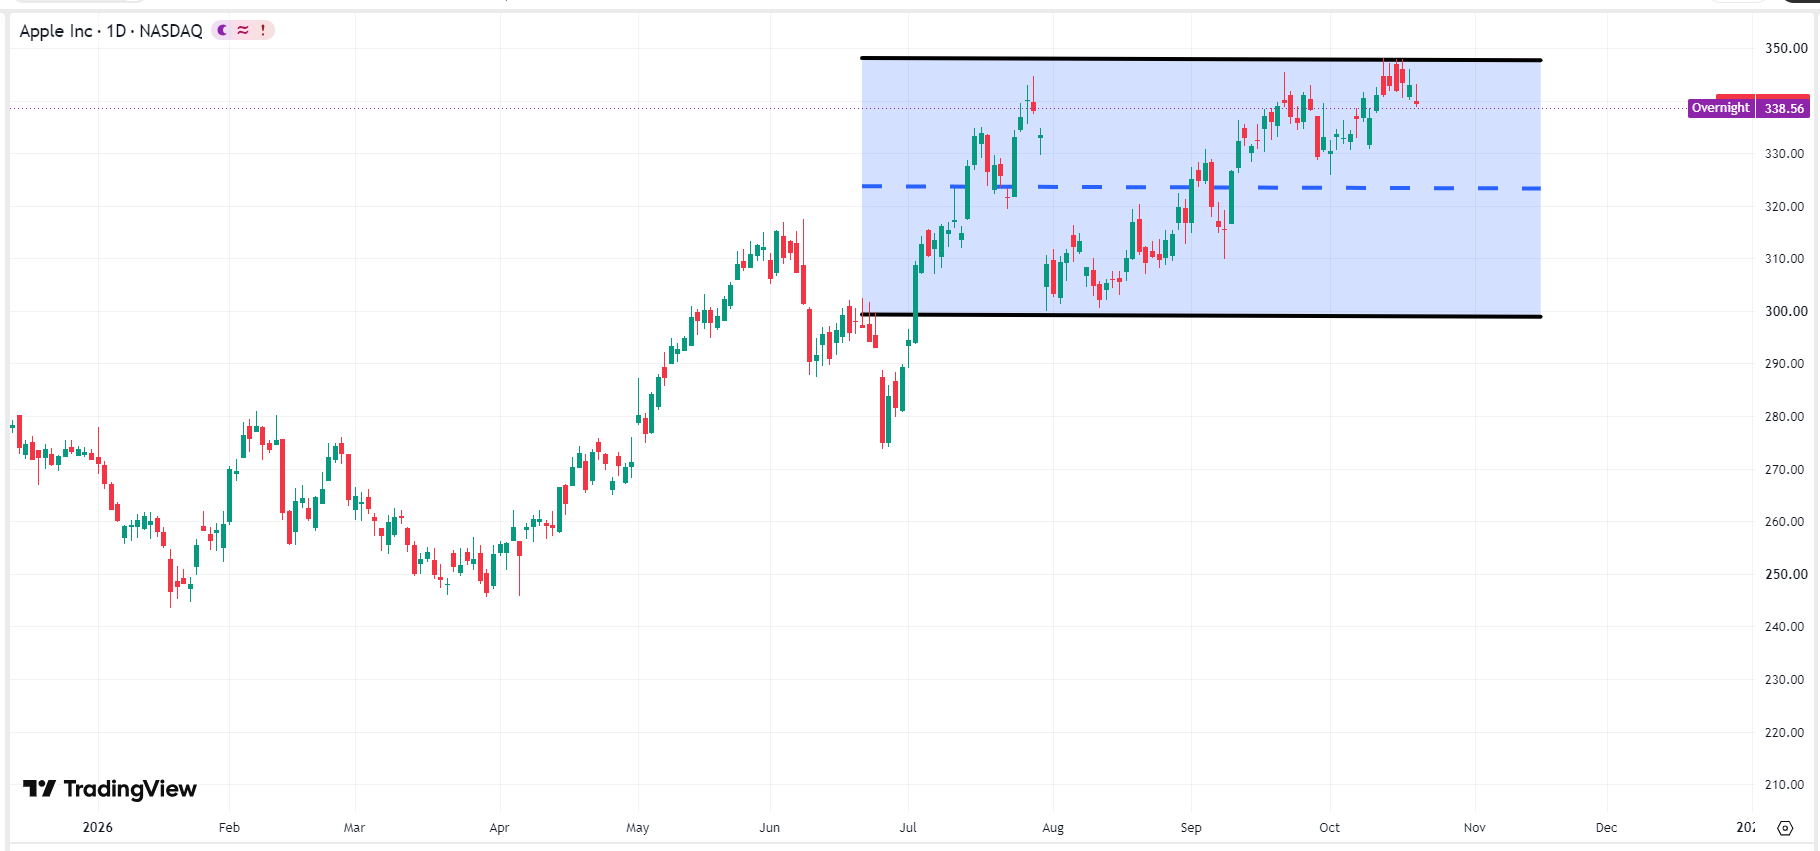
aapl-apple-price-d100e5f69c3a43a2ae6fc5f351c65b88Apple stock price chart, Source: TradingView

Apple's second support level lies near $300, serving not only as a psychological round-number mark and a 200-day moving average defense line, but also as the lower bound of the third-quarter consolidation. This position represents an ideal defensive position for institutional buying to drive valuation recovery, and will likely be tested only under extreme circumstances.

Disclaimer: For information purposes only. Past performance is not indicative of future results.
placeholder
Dollar presses 102 as the 10-year yield sits at 5.14% — and October hike odds are only 17%The dollar index closed at 101.99 (+0.20%) on Monday after briefly topping 102.07, while the 10-year Treasury yield rose to 5.14% and the 2-year hit 4.774% — yet futures price only about a 17% chance of a hike at the October 27-28 FOMC, versus roughly 90% for December. The driver is a global bond selloff, not a Fed repricing: France's 10-year OAT jumped to 4.84% ~ 4.94% and the OAT-Bund spread widened to 140 ~ 146bp. Here are the levels, the cross-asset read-through and what to watch.
Author  Irene Q.
Oct 20, Tue
The dollar index closed at 101.99 (+0.20%) on Monday after briefly topping 102.07, while the 10-year Treasury yield rose to 5.14% and the 2-year hit 4.774% — yet futures price only about a 17% chance of a hike at the October 27-28 FOMC, versus roughly 90% for December. The driver is a global bond selloff, not a Fed repricing: France's 10-year OAT jumped to 4.84% ~ 4.94% and the OAT-Bund spread widened to 140 ~ 146bp. Here are the levels, the cross-asset read-through and what to watch.
placeholder
Meta's AI bill just hit $145 billion — and it issued a new share class to pay for itMeta reported record third-quarter revenue of $64.60 billion, up 26% from a year earlier, and raised full-year 2026 capital expenditure guidance to $135-145 billion from $130-145 billion. To fund that build-out without touching Mark Zuckerberg's voting control, the company announced a 2-for-1 stock split that hands every Class A holder a new non-voting Class C share. Here are the four lines that matter, the peer group that is being re-rated alongside it, and the bull and bear cases.
Author  Irene Q.
Oct 22, Thu
Meta reported record third-quarter revenue of $64.60 billion, up 26% from a year earlier, and raised full-year 2026 capital expenditure guidance to $135-145 billion from $130-145 billion. To fund that build-out without touching Mark Zuckerberg's voting control, the company announced a 2-for-1 stock split that hands every Class A holder a new non-voting Class C share. Here are the four lines that matter, the peer group that is being re-rated alongside it, and the bull and bear cases.
placeholder
The Fed will sit still on October 28 — but 100 of 100 economists now expect a December hikeA Reuters poll run October 16-20 found 94 of 100 economists expecting the Fed to hold at 3.75-4.00% on October 28 — and all 100 expecting a hike in December, against less than half a month earlier. The market is close to the same price, with CME FedWatch at roughly 17% for October and 82.8% for December. With the Fed in blackout since October 17, here are the five dates that decide the rest of the year, what each one is priced for, and the two directions each can take.
Author  Irene Q.
Oct 22, Thu
A Reuters poll run October 16-20 found 94 of 100 economists expecting the Fed to hold at 3.75-4.00% on October 28 — and all 100 expecting a hike in December, against less than half a month earlier. The market is close to the same price, with CME FedWatch at roughly 17% for October and 82.8% for December. With the Fed in blackout since October 17, here are the five dates that decide the rest of the year, what each one is priced for, and the two directions each can take.
placeholder
Gold Price Analysis Today | Forex Gold Analysis | XAU/USD Analysis - October 23, 2026Get the latest gold price analysis, forex gold insights, and XAU/USD analysis for October 23, 2026. Read on for the details.
Author  Mitrade
Yesterday 02: 56
Get the latest gold price analysis, forex gold insights, and XAU/USD analysis for October 23, 2026. Read on for the details.
placeholder
Nasdaq closes at 26,008.86 — 8.9 points above 26,000, and the credit market never blinkedThe Nasdaq Composite fell 2.60% to 26,008.86 on October 22, its worst session since June, as Meta sank 6.98% on 2026 capex guidance of $135–145 billion. But the equal-weight S&P 500 rose 0.73%, high-yield credit was flat and 10-year yields fell 20 basis points. This was an AI de-rating, not a risk-off event — here is the transmission chain, the 29,000 / 28,200 levels and what would prove it wrong.
Author  Irene Q.
21 hours ago
The Nasdaq Composite fell 2.60% to 26,008.86 on October 22, its worst session since June, as Meta sank 6.98% on 2026 capex guidance of $135–145 billion. But the equal-weight S&P 500 rose 0.73%, high-yield credit was flat and 10-year yields fell 20 basis points. This was an AI de-rating, not a risk-off event — here is the transmission chain, the 29,000 / 28,200 levels and what would prove it wrong.
goTop
quote