


Tesla Stock Price Forecast: Can TSLA Stock Break $400 as Q3 Earnings Approach?
TradingKey - Tesla (TSLA) is scheduled to release its third-quarter 2026 financial results after market close on October 21 ET. Although the company's previously announced third-quarter deliveries exceeded market expectations, investors need to focus on whether these sales can translate into profits, free cash flow, and more stable gross margins against the backdrop of rising capital expenditures and increased investments in AI and autonomous driving. Meanwhile, after hitting a period high in early October, TSLA's stock price suffered a continuous pullback before recently rebounding to near $370, making this earnings report a key variable in determining whether the short-term stock price can retest its previous high.
Tesla Q3 Earnings Preview: Sales Aren't the Biggest Issue, Profit and Cash Flow Are More Critical
From an expectations standpoint, Tesla's third-quarter revenue is expected to reach $28.341 billion, with automotive revenue at approximately $20.272 billion and energy revenue at roughly $3.720 billion. GAAP EPS is projected at $0.23, and non-GAAP EPS at around $0.45. The market anticipates an overall gross margin of 17.9% and an operating margin of only about 2.5%. In terms of volume, Tesla previously reported its third-quarter data: production reached 464,391 vehicles and deliveries totaled 486,532 vehicles, exceeding prior market expectations. Energy storage deployments reached 13.7 GWh.
For this earnings report, the primary focus is automotive gross margin. The market expects third-quarter automotive revenue to remain under pressure year-over-year, while regulatory credit revenue is projected to fall significantly. If the gross margin comes in above market expectations, even if automotive revenue growth remains limited, it could ease market concerns regarding price cuts, product mix, and cost pressures. Conversely, if delivery volumes beat expectations while the gross margin continues to slide, the stock price could face renewed headwind from revisions to profitability expectations.
The second key focus is capital expenditures and free cash flow. Company-compiled consensus estimates show third-quarter capital expenditures of approximately $7.77 billion, with free cash flow projected at negative $4.5 billion. Full-year capital expenditures are expected to exceed $25 billion, reflecting a noticeable increase in investments driven by Cybercab, AI training infrastructure, Optimus, and factory construction. If capital expenditures continue to climb while AI and autonomous driving revenues have yet to grow in tandem, cash flow will remain a major constraint on valuation; however, if cash burn is lower than expected, it could provide support for the stock price.
Tesla Stock Price Technical Analysis
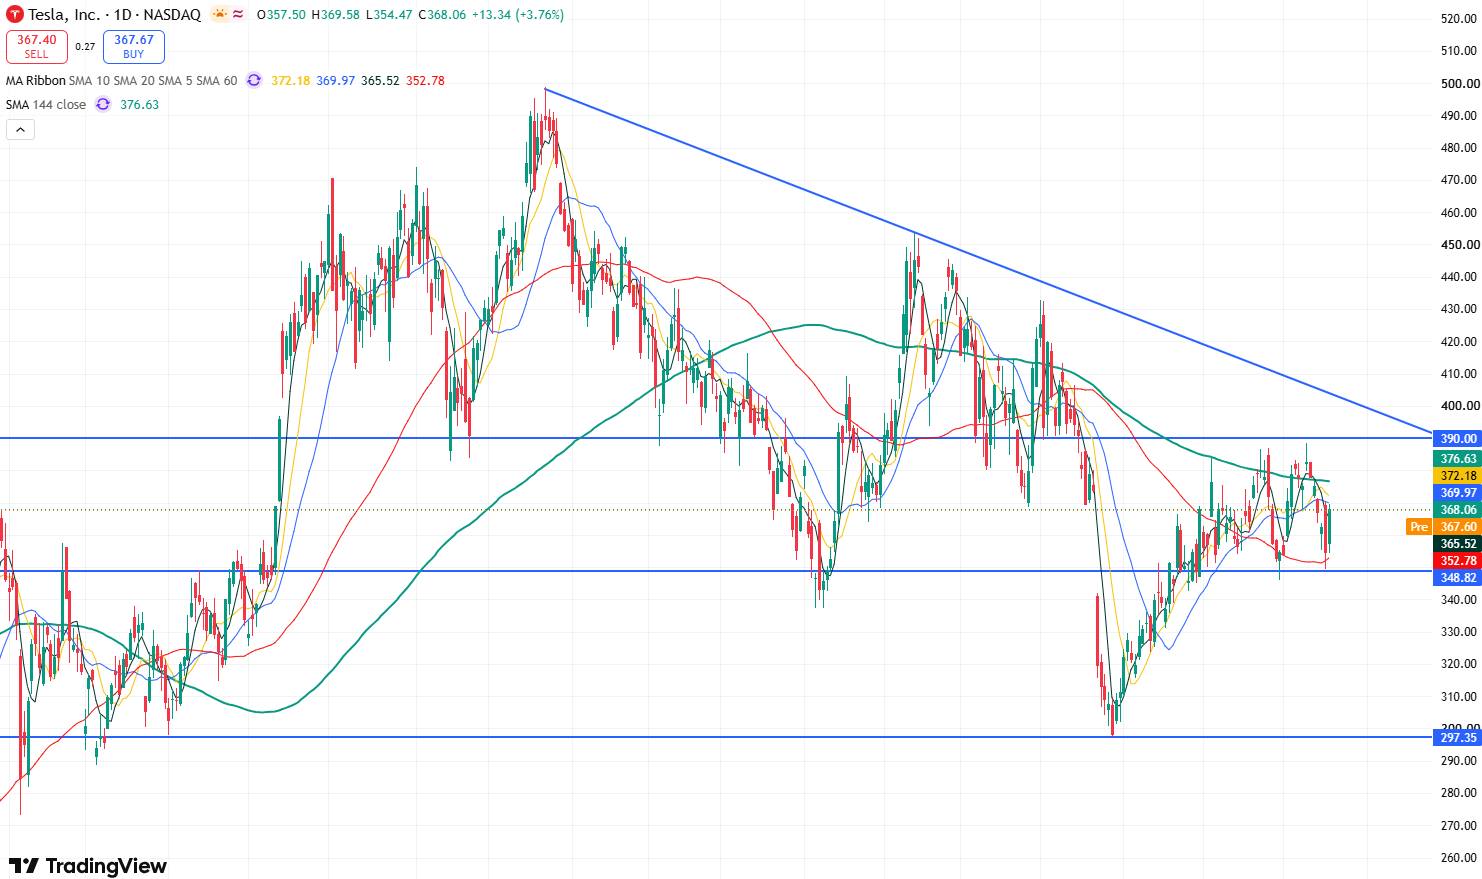
Tesla stock price daily chart, Source: TradingView
Based on Tesla's daily stock price chart, the stock pulled back consecutively after reaching $388.56 on October 9 and retested the $350 support level on October 16. The candlestick structure formed a double-bottom pattern, supporting Monday's rebound and indicating an improvement in the short-term bullish structure.
Currently, the primary resistance level to watch on the upside is $390–$400. Note that $400 lies near the downward trendline formed by connecting previous candlestick highs. If the stock can break out strongly and hold above this level, it will open up further upside room, with the potential to test the $450 resistance level and, further up, challenge the $500 mark.
On the downside, the primary support level to watch is $350. If this level is lost, the stock price may pull back further toward the $300 mark.
Recommended Articles


