


3 Key Metrics That Will Determine Whether the Stock Market Can Keep Moving Higher
Key Points
Investors have battled through the Iran war, higher inflation, rising interest rates, and concerns about artificial intelligence.
Oil prices and bond yields are two metrics investors will need to carefully watch.
How S&P 500 earnings growth trends and expectations for future growth are also important.
- 10 stocks we like better than S&P 500 Index ›
Despite seemingly hitting a wall during the past month, the broader benchmark S&P 500 (SNPINDEX: ^GSPC) is still up more than 13% this year.
That's impressive when you consider the index generated 20%-plus returns in 2023 and 2024, and considering all of the challenges the market has had to overcome this year, including the Iran war, high gas prices, soaring bond yields, rising interest rates, and skepticism over artificial intelligence.
Missed AI’s "Act 1"? Act 2 Could Be 15x Bigger. Most investors think they missed the AI boat because they didn't buy Nvidia in 2005. But according to our analysts, we’re only at the end of "Act 1"—the R&D phase. "Act 2" is the global rollout. Continue »
But as history has shown, markets are nearly impossible to time. History doesn't always offer a good forecast of the future, bull markets can last longer than anyone expects, and a big sell-off can also unfold quickly.
Still, investors can monitor certain metrics to gauge market conditions and watch for warning signs or positive signals suggesting the market can keep moving higher. Here are three key metrics to watch.

Image source: Getty Images.
1. Oil prices and supply
Oil prices have a significant impact on the economy. Not only do they influence gas prices at the pump, but they also make everything feel more expensive because so many goods and services require transportation to get from one place to another.
High oil prices have also increased inflation expectations and likely contributed to the Federal Reserve's recent decision to raise interest rates.
The Iran war, which essentially closed the Strait of Hormuz, a key oil chokepoint bordering Iran and Oman, sent oil prices soaring. As of this writing, West Texas Intermediate (WTI) Crude oil traded slightly below $91 per barrel, while Brent Crude traded around $99.40. WTI directly influences U.S. gas prices.
I think many investors have been surprised that oil prices haven't gone even higher and that the market has remained resilient, despite elevated oil prices.
Perhaps the economy will remain resilient if oil prices rise more, but I don't think investors will hold the line forever. The U.S. Strategic Petroleum Reserve (SPR) ended the week of Sept. 11 with less than 285 million barrels, the lowest level since 1982.
Not only are the reserves nearing "critical levels" of below 250 million barrels, but getting down this low also risks damaging the caverns where the oil is stored, according to experts.
2. Long-term bond yields
Higher inflation expectations and concerns over mounting U.S. debt, which is not exactly a new problem, have led to a sharp increase in bond yields, particularly those on longer-dated U.S. Treasury bonds.
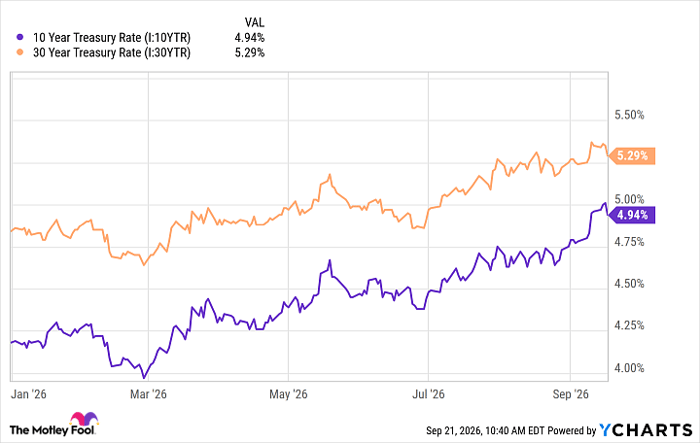
10 Year Treasury Rate data by YCharts
Higher bond yields are typically bearish for stocks because they make safer assets, such as bonds guaranteed by the U.S. government, more appealing, essentially increasing the bar for riskier assets, like stocks.
Higher bond yields also make borrowing much more expensive for consumers and businesses. High mortgage rates, coupled with high home values, have made buying a house difficult for many Americans. Also, new debt the U.S. issues comes with much higher interest costs, forcing increased spending by the federal government.
Similar to oil prices, I think we are nearing bond yield levels we won't want to exceed. Since the Great Recession in 2008, the economy has been in an ultra-low-interest rate environment until the Fed began hiking rates in 2022.
Although those low rates after the Great Recession didn't coincide with a healthy economic environment, the economy adapted, so a rapid reversal to much higher rates could lead to a tough adjustment period.
3. S&P 500 earnings estimates
If there's one thing that's kept the S&P 500 moving higher despite all the challenges, it's that the S&P's collective earnings and forward earnings estimates continue to surge.
At the end of the day, most investors value the S&P 500 based on earnings multiples. If earnings keep growing, that's often enough to push the market higher, regardless of other challenges. And if earnings continue to grow, investors will often award that index or stock a higher multiple.
In 2025, the S&P 500 generated roughly $271 per share of earnings. This year, strategists, on average, expect nearly $363 in earnings per share, or 34% growth, according to research from LSEG published on Sept. 11. In 2027, analysts expect that number to rise another 15%.
Sure, that may not be as strong as 2025 or 2026, but it's still very solid. Now, some investors may see this and believe the market has hit peak earnings growth and decide it's time to lower the multiple and therefore their price targets.
It's hard to say how investors will react, but investors should ultimately keep an eye on forward S&P 500 earnings estimates. Although 15% growth in 2027 may not drive the market much higher, it's still growth and probably can support current levels.
Investors should be watching whether those estimates move lower or higher. That's ultimately going to determine if the market can keep pushing higher.
Should you buy stock in S&P 500 Index right now?
Before you buy stock in S&P 500 Index, consider this:
The Motley Fool Stock Advisor analyst team just identified what they believe are the 10 best stocks for investors to buy now… and S&P 500 Index wasn’t one of them. The 10 stocks that made the cut could produce monster returns in the coming years.
Consider when Netflix made this list on December 17, 2004... if you invested $1,000 at the time of our recommendation, you’d have $389,154!* Or when Nvidia made this list on April 15, 2005... if you invested $1,000 at the time of our recommendation, you’d have $1,406,303!*
Now, it’s worth noting Stock Advisor’s total average return is 949% — a market-crushing outperformance compared to 214% for the S&P 500. Don't miss the latest top 10 list, available with Stock Advisor, and join an investing community built by individual investors for individual investors.
See the 10 stocks »
*Stock Advisor returns as of September 24, 2026.
Bram Berkowitz has no position in any of the stocks mentioned. The Motley Fool recommends London Stock Exchange Group Plc. The Motley Fool has a disclosure policy.
Recommended Articles


