

Gold Price Forecast: Gold Drops Below $4,300, Will It Continue to Fall?

Mitrade
coverImg
Source: DepositPhotos

TradingKey - As of the European session on September 24, gold prices (XAUUSD) extended their correction, dipping below $4,300 intraday to hit a low of $4,262.45. After previously rebounding close to $4,400, gold prices retreated continuously and have now broken below the psychological $4,300 level, with the short-term trend weakening significantly.

Fed Rate-Hike Expectations Rise, But Falling Oil Prices Limit Gold Losses

In the near term, the main pressure on gold continues to stem from Federal Reserve policy expectations. The preliminary U.S. September Composite PMI rose to 58.4, reaching its highest level since July 2021 and showing that economic activity remains robust. Meanwhile, Federal Reserve Governor Michael Barr stated that further rate hikes may still be needed in the future to bring down inflation. Following the data release, the market's expected probability of another rate hike in October rose from 55.4% to 75.3%, and the 10-year U.S. Treasury yield rose to 5.148%, reaching a new high since 2007. A stronger U.S. dollar and elevated Treasury yields continue to increase the opportunity cost of holding non-yielding gold, keeping gold prices under pressure and continuing to pull back.

However, the pullback in oil prices is providing some support for gold. Iran stated that it remains willing to end its conflict with the U.S. through diplomatic means and is evaluating the U.S. response to the peace plan. Driven by negotiation expectations, WTI crude fell about 0.8% in early Thursday trading to $91.23, and Brent crude briefly fell below $100. If U.S.-Iran negotiations continue to make progress and drive energy prices down, future U.S. inflation pressures may ease accordingly, reducing the need for sustained Fed rate hikes and thereby supporting a rebound in gold prices.

Gold Price Technical Analysis
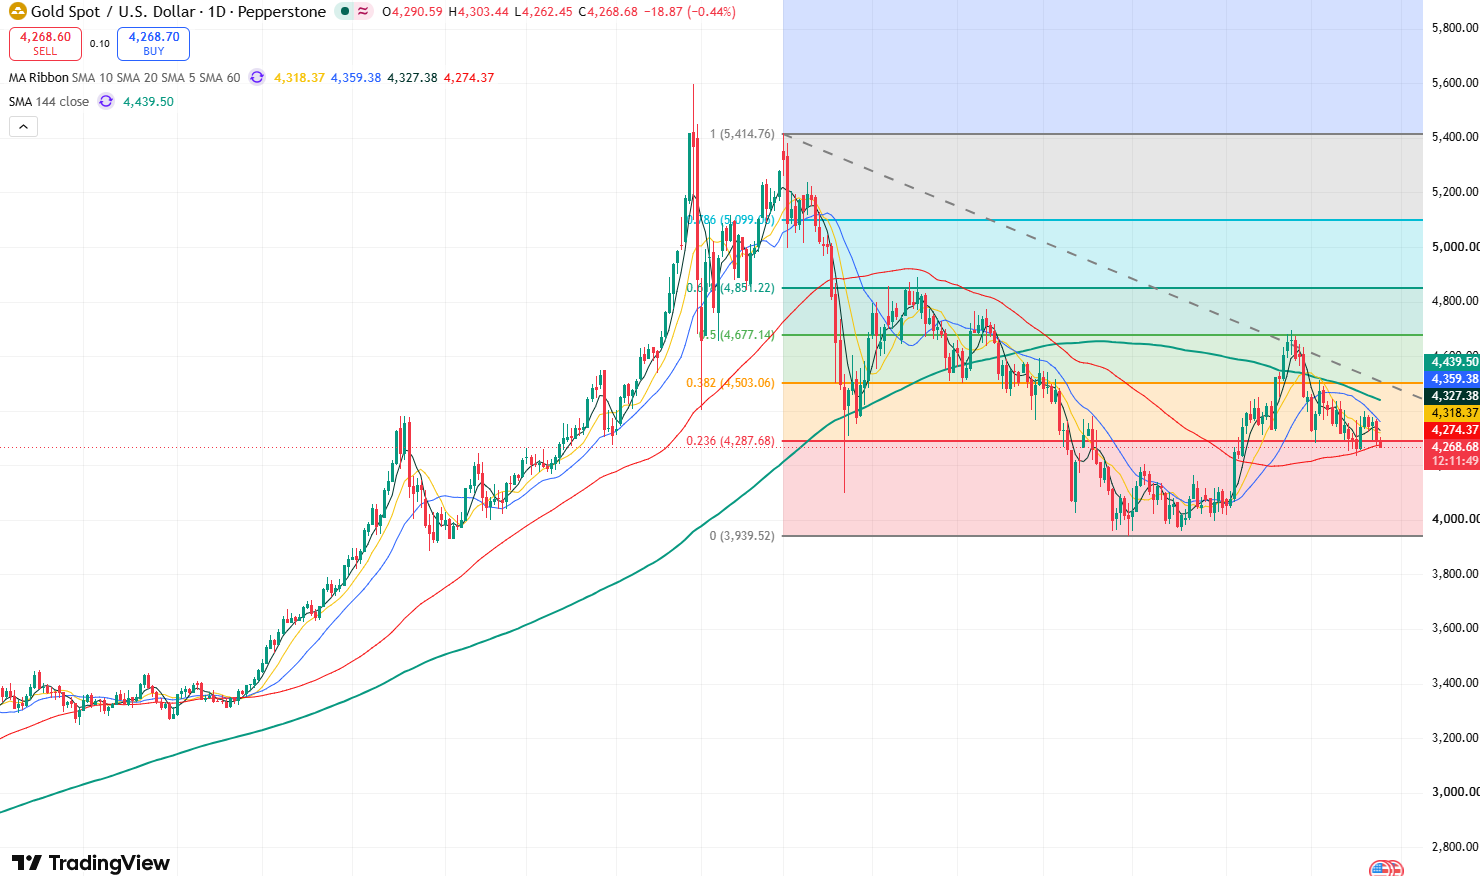
gold-80ec59d6043047c2a0f41896b88518b0

Gold price daily chart, Source: TradingView

Looking at the daily chart of gold prices, gold has continuously pulled back from near $4,400 and has currently broken below $4,300, indicating that market bearish sentiment clearly dominates. Meanwhile, in terms of technical indicators, short-term moving averages and the MACD indicator both show weakness, while the RSI index stands around 43 in weak territory without entering oversold territory, showing that short-term selling pressure still holds the upper hand.

At present, gold prices have once again retested the 60-day moving average near $4,270, briefly dipping below this level intraday. If today's closing price ends below this level, gold prices may continue to pull back in the short term; if prices hold firm above this level, gold prices will see a technical corrective rebound in the short term.

On the downside, the primary support level to watch below is the September 16 low of $4,235. If this level fails to hold, gold prices may test the $4,200 mark downward. If the decline continues, gold prices could fall further toward the $4,000 mark.

On the upside, the primary resistance level to watch above is $4,300. If gold can hold firm above this level, it will continue to test $4,400 upward, with potential to rise further to near $4,510.

Read more

  • Gold Price Forecast: XAU/USD drifts toward $4.300 with bears gaining traction
  • US Special Envoy Witkoff says mediators completed round of US-Iran talks
  • Bitcoin Cash Surges 30% in Single Day as Catch-Up Rally Explodes, Far Outpacing BTC
  • * The content presented above, whether from a third party or not, is considered as general advice only.  This article should not be construed as containing investment advice, investment recommendations, an offer of or solicitation for any transactions in financial instruments.

    goTop
    quote
    Related Articles
    placeholder
    US input costs rose at the fastest pace in four years — the September flash PMI beat is an inflation story, not a growth storyUS September flash PMIs came in far above expectations, with the composite at 58.4, a five-year high. But the detail that moved markets was input cost inflation at its fastest since October 2022, driven by fuel, transport and supply shortages. Brent is back above $100 and the 10-year Treasury yield has hit its highest since 2007.
    Author  Suzie
    7 hours ago
    US September flash PMIs came in far above expectations, with the composite at 58.4, a five-year high. But the detail that moved markets was input cost inflation at its fastest since October 2022, driven by fuel, transport and supply shortages. Brent is back above $100 and the 10-year Treasury yield has hit its highest since 2007.
    placeholder
    Gold Price Forecast: XAU/USD drifts toward $4.300 with bears gaining tractionGold (XAU/USD) retraces Tuesday’s gains on Wednesday and drifts lower, approaching the $4,300 area as the US Dollar Index (DXY) rallies further amid high US Treasury yields.
    Author  FXStreet
    Yesterday 10: 02
    Gold (XAU/USD) retraces Tuesday’s gains on Wednesday and drifts lower, approaching the $4,300 area as the US Dollar Index (DXY) rallies further amid high US Treasury yields.
    placeholder
    Gold Price Forecast: Gold Eyes Key $4,400 Resistance as Falling Oil Prices Ease Inflation PressureAs of the Asian session on September 21, gold prices (XAUUSD) maintained high-level consolidation intraday today following a strong rebound last week, with the latest price trading around
    Author  TradingKey
    Sep 21, Mon
    As of the Asian session on September 21, gold prices (XAUUSD) maintained high-level consolidation intraday today following a strong rebound last week, with the latest price trading around
    placeholder
    Today’s Market Recap: AI Chip Stocks Gain, SanDisk Surges Nearly 11%, Micron Rises Nearly 4%, Bitcoin Reclaims $80,000Tracking Market TrendsTradingKey - On September 18, Eastern Time, U.S. stocks capped off a volatile week with the three major benchmarks closing mixed. Tech and semiconductor stocks extended their reb
    Author  TradingKey
    Sep 21, Mon
    Tracking Market TrendsTradingKey - On September 18, Eastern Time, U.S. stocks capped off a volatile week with the three major benchmarks closing mixed. Tech and semiconductor stocks extended their reb
    placeholder
    Gold ends three-week slide at the $4,400 line — eight straight days of ETF inflows vs a 5% 10-year and a 100 dollarSpot gold closed Friday at $4,378.39, up 0.84% on the day and about 0.8% for the week — its first weekly gain in four weeks — with the intraday high of $4,399.67 leaving it 33 cents shy of the $4,400 line. Gold ETFs have now logged eight straight sessions of inflows, but with the 10-year back above 5% and the dollar index near 100, here is what decides whether this is a reversal or a bounce.
    Author  Suzie
    Sep 20, Sun
    Spot gold closed Friday at $4,378.39, up 0.84% on the day and about 0.8% for the week — its first weekly gain in four weeks — with the intraday high of $4,399.67 leaving it 33 cents shy of the $4,400 line. Gold ETFs have now logged eight straight sessions of inflows, but with the 10-year back above 5% and the dollar index near 100, here is what decides whether this is a reversal or a bounce.
    Live Quotes
    Name / SymbolChart% Change / Price
    XAUUSD
    XAUUSD
    0.00%0.00
    XAGUSD
    XAGUSD
    0.00%0.00

    Gold Related Articles

    • 10 Best Day Trading Platforms for Beginners and Active Traders in 2026: A Practical Guide
    • What is Gold CFD? How to Trade Gold CFD With Mitrade Example
    • ​5 Best Paper Trading Platforms for 2026 (Free Demo Accounts for Beginners & Traders)
    • XAU/USD Gold Price Trend Analysis 2026: Will It Keep Rising?
    • Is Mitrade Right for You? A Complete Guide on How to Start Trading CFDs in 5 Steps
    • How and Where to Buy Gold in Australia? A Complete Guide for Beginners

    Click to view more