


The Market Is Doing Something It's Only Done Once Before. Here's What History Says Happens Next.
Key Points
The market hasn't had back-to-back years of double-digit gains since the late 1990s.
The CAPE ratio, which adjusts the average P/E ratio for inflation, is at its second-highest level ever.
Jamie Dimon expects hyperscalers to spend $1 trillion on AI next year.
- 10 stocks we like better than S&P 500 Index ›
The S&P 500 (SNPINDEX: ^GSPC) is up a phenomenal 14% year to date, and if this year is anything like previous years, it will end 2026 even higher. That would be the fourth year in a row with double-digit gains, which hasn't happened since the late 1990s, when the S&P 500 had five years of double-digit gains.
There's something else that hasn't happened since then, either. The cyclically adjusted price-to-earnings ratio, or CAPE ratio, surpassed 40 only one other time -- in January 1999, the fifth year of double-digit market gains.
Missed Nvidia in 2009? This Rare Signal Is Flashing Again. In 2009, a "Double Down" signal flashed for a little-known chipmaker called Nvidia. For the first time in years, that same "Total Conviction" signal is flashing for a company 1/100th the size of Nvidia. Continue »
This metric, which adjusts the price-to-earnings ratio for inflationary impact, is seen as a more reliable valuation metric for the market than the average P/E ratio for the 500 stocks in the index. Today, it's nearly 41 after surpassing the 40 mark in May.
The CAPE ratio reached 44 in January 2000, preceding three years of market losses. Should investors be worried?
Bull markets and rich valuations
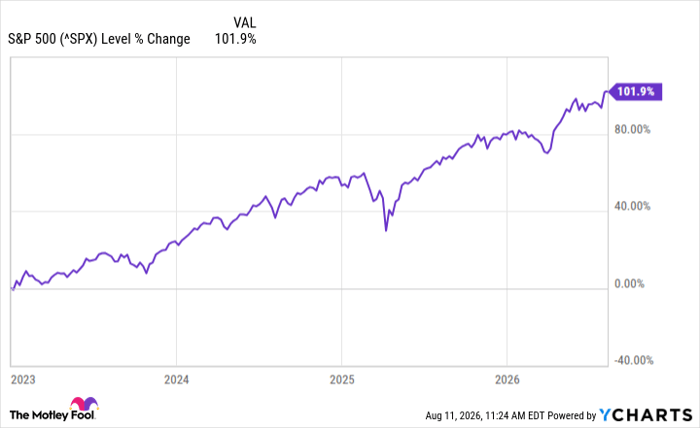
The market has enjoyed a strong bull run over the past three and a half years, doubling since the beginning of 2023.
^SPX data by YCharts
The gains have been driven by artificial intelligence (AI), which didn't exist as an industry before 2023. Over the past three years, the category has grown by leaps and bounds, and the large companies that are leading the charge continue to invest billions in developing their platforms. Companies like Amazon and Alphabet are planning to spend about $700 billion this year, and, according to JPMorgan Chase's Jamie Dimon, that will increase to $1 trillion next year.
Some of the biggest gainers aren't these hyperscalers themselves but the infrastructure companies that provide the data centers, energy, and memory products to make this all happen. A large chunk of the massive spend is going to these companies, and they're already experiencing incredible growth.

Image source: Getty Images.
All this appears quite similar to the dot-com bubble that led to a boom-and-bust in 2000. Extraordinary sums were being spent on internet-based businesses, which were then new. Eventually, big money pulled out of these unprofitable businesses.
Is now any different? It could be. But the similarities, from the gargantuan investments to the years of market gains to the rising CAPE ratio, are glaring.
Bargains and opportunities
Make sure you have a fully diversified portfolio that includes growth stocks to benefit from current AI trends, as well as defensive stocks in case the market crashes. This should always be your setup, but it's even more critical considering today's market conditions.
If you've been focused on hot growth stocks, the time to make the shift is before things go south. By then, it will be too late. If your portfolio is packed with resilient dividend stocks, it will be able to withstand a downturn.
Don't forget that the S&P 500 has always rebounded and gone on to new heights. There could be a prolonged period of weakness, as there was in 2000, when the broader index lost value for three consecutive years. But since 2003, it has gained 782%. Stay in it to win it.
Should you buy stock in S&P 500 Index right now?
Before you buy stock in S&P 500 Index, consider this:
The Motley Fool Stock Advisor analyst team just identified what they believe are the 10 best stocks for investors to buy now… and S&P 500 Index wasn’t one of them. The 10 stocks that made the cut could produce monster returns in the coming years.
Consider when Netflix made this list on December 17, 2004... if you invested $1,000 at the time of our recommendation, you’d have $421,943!* Or when Nvidia made this list on April 15, 2005... if you invested $1,000 at the time of our recommendation, you’d have $1,382,819!*
Now, it’s worth noting Stock Advisor’s total average return is 983% — a market-crushing outperformance compared to 216% for the S&P 500. Don't miss the latest top 10 list, available with Stock Advisor, and join an investing community built by individual investors for individual investors.
See the 10 stocks »
*Stock Advisor returns as of August 15, 2026.
JPMorgan Chase is an advertising partner of Motley Fool Money. Jennifer Saibil has no position in any of the stocks mentioned. The Motley Fool has positions in and recommends Alphabet, Amazon, and JPMorgan Chase. The Motley Fool has a disclosure policy.
Recommended Articles


