

For the First Time in Over 155 Years, the Stock Market May Be Headed Here -- and It's Not Good News for Investors
Key Points
The S&P 500 has more than tripled investors' money over the past decade.
AI-fueled speculation has driven the stock market closer to its priciest valuation ever.
History shows that periods like these are often followed by sharp reversals.
- 10 stocks we like better than S&P 500 Index ›
Over the past decade, the S&P 500 (SNPINDEX: ^GSPC) has delivered a phenomenal total return of around 250%, compounding at roughly 13.4% annually. Over the last year alone, the stock market, driven by developments in artificial intelligence (AI), has surged almost 23%, with its ferocity drawing comparison to some of the strongest bull runs in market history.
That's less reassuring than it sounds.
Will AI create the world's first trillionaire? Our team just released a report on the one little-known company, called an "Indispensable Monopoly" providing the critical technology Nvidia and Intel both need. Continue »

Image source: Getty Images.
A market that's gone too far, too fast
The stock market is currently trading near its most expensive valuation ever. That's not an exaggeration. The last time the market was this richly valued, it was in the months preceding one of the ugliest crashes Wall Street has ever seen -- the dot-com debacle of the early 2000s.
What do I mean by "richly valued"? In simplest terms, today's investors are paying more for each dollar of corporate earnings than at almost any point in history. One way to measure that is the Shiller CAPE ratio, which compares the current price of an index (like the S&P 500) to inflation-adjusted earnings over the previous 10 years.
Thanks to some clever statistical work, the CAPE ratio, introduced in the late 1980s, has been backtracked to 1871, giving us 155 years of historical context. Over that time, CAPE has averaged about 17. Take a gander at where it is now.
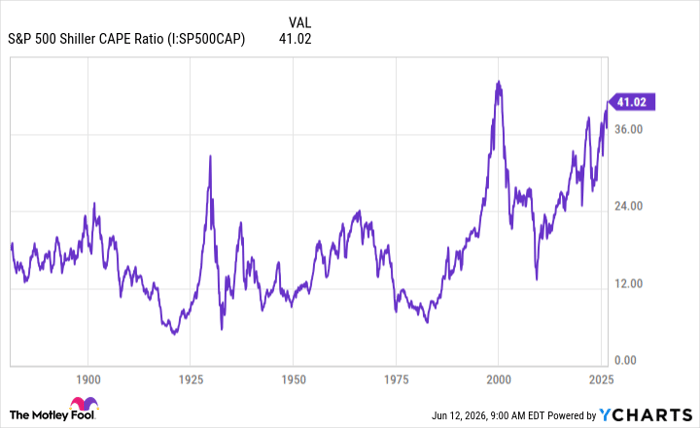
Data by YCharts
Is a stock market crash imminent?
Looking at the chart, we can see that the CAPE ratio has spiked only twice. The first came just before the Great Depression in the late 1920s, and the second came in the late-90s run-up to the dot-com crash.
Does that mean a stock market crash is coming? Not necessarily. Stock market metrics like the CAPE ratio can help us compare valuation levels, but they can't predict the future. If history is a reliable guide, periods like this one often precede sharp reversals, yet that doesn't mean the stock market will fall like it did in 2000 again.
The market often rewards investors who stay put long-term rather than try to buy and sell at the "right" time. Look closely at the stocks you're buying, as strong fundamentals will outlast short-term trends and hype.
Should you buy stock in S&P 500 Index right now?
Before you buy stock in S&P 500 Index, consider this:
The Motley Fool Stock Advisor analyst team just identified what they believe are the 10 best stocks for investors to buy now… and S&P 500 Index wasn’t one of them. The 10 stocks that made the cut could produce monster returns in the coming years.
Consider when Netflix made this list on December 17, 2004... if you invested $1,000 at the time of our recommendation, you’d have $433,268!* Or when Nvidia made this list on April 15, 2005... if you invested $1,000 at the time of our recommendation, you’d have $1,259,391!*
Now, it’s worth noting Stock Advisor’s total average return is 935% — a market-crushing outperformance compared to 207% for the S&P 500. Don't miss the latest top 10 list, available with Stock Advisor, and join an investing community built by individual investors for individual investors.
See the 10 stocks »
*Stock Advisor returns as of June 14, 2026.
Steven Porrello has no position in any of the stocks mentioned. The Motley Fool has no position in any of the stocks mentioned. The Motley Fool has a disclosure policy.
Recommended Articles


