


US Dollar Index Price Forecast: Turns sideways after hitting fresh yearly highs near 102.50
- The US Dollar starts the US CPI week on a subdued note.
- Financial markets expect the US inflation to have grown at a faster pace in September.
- MUFG expects the Fed to hold interest rates steady this month unless the US CPI surprises to the upside.
The US Dollar (USD) trades subduedly at the start of the United States (US) Consumer Price Index (CPI) week. In the European trade, the US Dollar Index (DXY), which gauges the Greenback’s value against six major currencies, trades almost flat at around 102.22. The USD Index has turned sideways after posting a fresh yearly high at 102.54 last week.
This week, the US Dollar is expected to face a significant volatility as the US CPI data for September is scheduled to be published on Wednesday. The inflation data is expected to have a meaningful impact on Federal Reserve’s (Fed) interest rate expectations.
Analysts at MUFG/BTMU said in a note that "market expectations for the Fed to stay on hold this month will be tested by the release on Wednesday of the latest US CPI report for September." MUFG/BTMU add that "unless there is a significant upside surprise for underlying inflation, we expect the Fed to leave rates on hold this month."
The US CPI report will likely show that the headline inflation accelerated to 3.7% Year-on-Year (YoY) from the previous reading of 3.4%. The core CPI – which excludes volatile food and energy items – is expected to come in at 2.5% YoY, higher than the previous reading of 2.4%.
US Dollar Index Technical Analysis
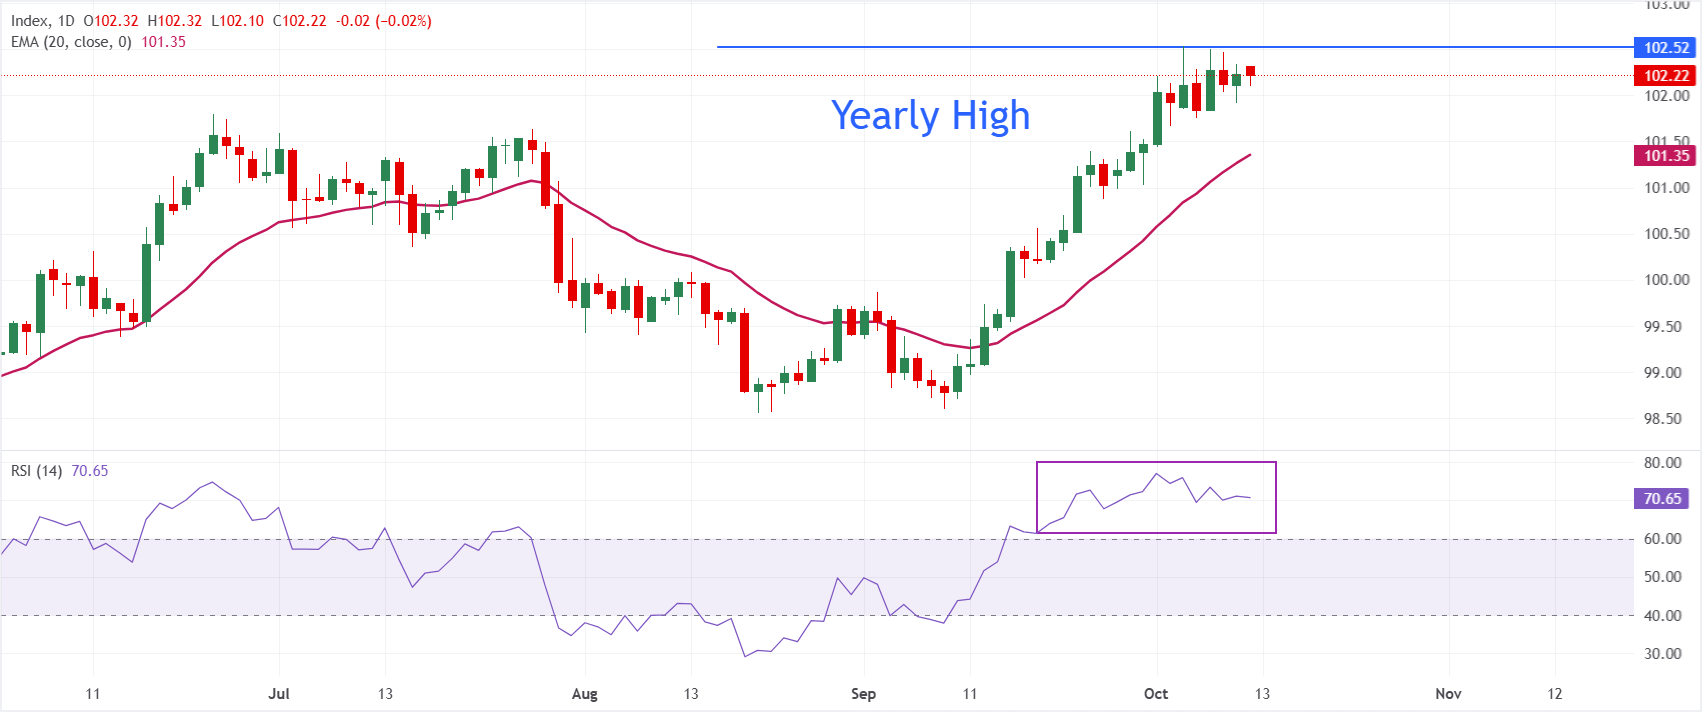
In the daily chart, Dollar Index Spot trades at 102.22, maintaining a bullish near-term bias as price holds well above the 20-day exponential moving average (EMA) at 101.35. The distance from this dynamic support suggests the recent advance remains intact, while the Relative Strength Index (RSI) at 70.65 sits in overbought territory, hinting that upside momentum is strong but increasingly vulnerable to consolidation or a corrective pause.
On the downside, initial support is located at the 20-day EMA around 101.35, where a pullback would be expected to attract dip-buying interest as long as the broader uptrend is preserved. Looking up, the Dollar Index could enter a fresh upside leg if it decisively breaks above the yearly high at 102.54.
(The technical analysis of this story was written with the help of an AI tool. Know more.)
Economic Indicator
Consumer Price Index (YoY)
Inflationary or deflationary tendencies are measured by periodically summing the prices of a basket of representative goods and services and presenting the data as The Consumer Price Index (CPI). CPI data is compiled on a monthly basis and released by the US Department of Labor Statistics. The YoY reading compares the prices of goods in the reference month to the same month a year earlier.The CPI is a key indicator to measure inflation and changes in purchasing trends. Generally speaking, a high reading is seen as bullish for the US Dollar (USD), while a low reading is seen as bearish.
Read more.Next release: Wed Oct 14, 2026 12:30
Frequency: Monthly
Consensus: 3.7%
Previous: 3.4%
Source: US Bureau of Labor Statistics
The US Federal Reserve (Fed) has a dual mandate of maintaining price stability and maximum employment. According to such mandate, inflation should be at around 2% YoY and has become the weakest pillar of the central bank’s directive ever since the world suffered a pandemic, which extends to these days. Price pressures keep rising amid supply-chain issues and bottlenecks, with the Consumer Price Index (CPI) hanging at multi-decade highs. The Fed has already taken measures to tame inflation and is expected to maintain an aggressive stance in the foreseeable future.
Recommended Articles


