


Gold Price Forecast: Gold Returns to $4,200 Ahead of US September CPI, Can the Rally Continue?
TradingKey - As of the Asian session on October 12, gold prices (XAUUSD) consolidated at high levels following a sharp rebound last week. As of press time, gold prices were down slightly by 0.2%, trading around $4,185, having touched a new high of $4,217.22 since October 2 during intraday trading. Gold prices had dropped to near $4,066 last week before quickly rebounding, improving the short-term trend.
Falling Oil Prices Ease Inflation Concerns as US September CPI Becomes Next Key Variable
From a fundamental perspective, the primary factors recently influencing gold price movements have been oil prices and the trajectory of the US dollar.
US President Donald Trump announced on Sunday that Russia and Ukraine reached a ceasefire arrangement on energy facilities, effective immediately. However, Ukrainian President Volodymyr Zelenskyy stated that he is still awaiting specific details of the agreement, leaving uncertainty surrounding the implementation of the arrangement.
Following the announcement, market expectations for a recovery in Russian energy supplies mounted, sending international oil prices noticeably lower. During Monday's Asian trading session, Brent crude fell by as much as 1.3% to $102.33 per barrel, while WTI crude dropped 1.7% to $89.61 per barrel.
The pull-back in oil prices helps ease inflationary pressures stemming from higher energy costs, thereby alleviating market concerns over further rate hikes by the Federal Reserve. Meanwhile, the US Dollar Index pulled back slightly to around 102.16, also providing some support for dollar-denominated gold.
However, US inflationary pressures remain elevated, and the outlook for Federal Reserve monetary policy has not fundamentally changed. According to the CME FedWatch Tool, the market estimates a roughly 19.4% probability of another rate hike by the Fed in October, while the probability of a hike before December remains at 84.4%.
This week, the market will focus closely on the US September Consumer Price Index (CPI), due on Wednesday (October 14), as well as PPI and retail sales data to be released on Thursday.
Markets currently expect the US headline CPI in September to rise to 3.6%–3.7% year-over-year from 3.4% in August, largely driven by previous gains in energy prices; the core CPI year-over-year increase is expected to be around 2.5%.
If the actual CPI comes in below expectations—especially if core inflation slows further—the market may scale back expectations for rate hikes by year-end, putting pressure on the US dollar and US Treasury yields and creating favorable conditions for gold prices to continue rebounding. Conversely, if inflation exceeds expectations again, gold could face renewed pressure from a high-interest-rate environment.
Gold Price Technical Analysis
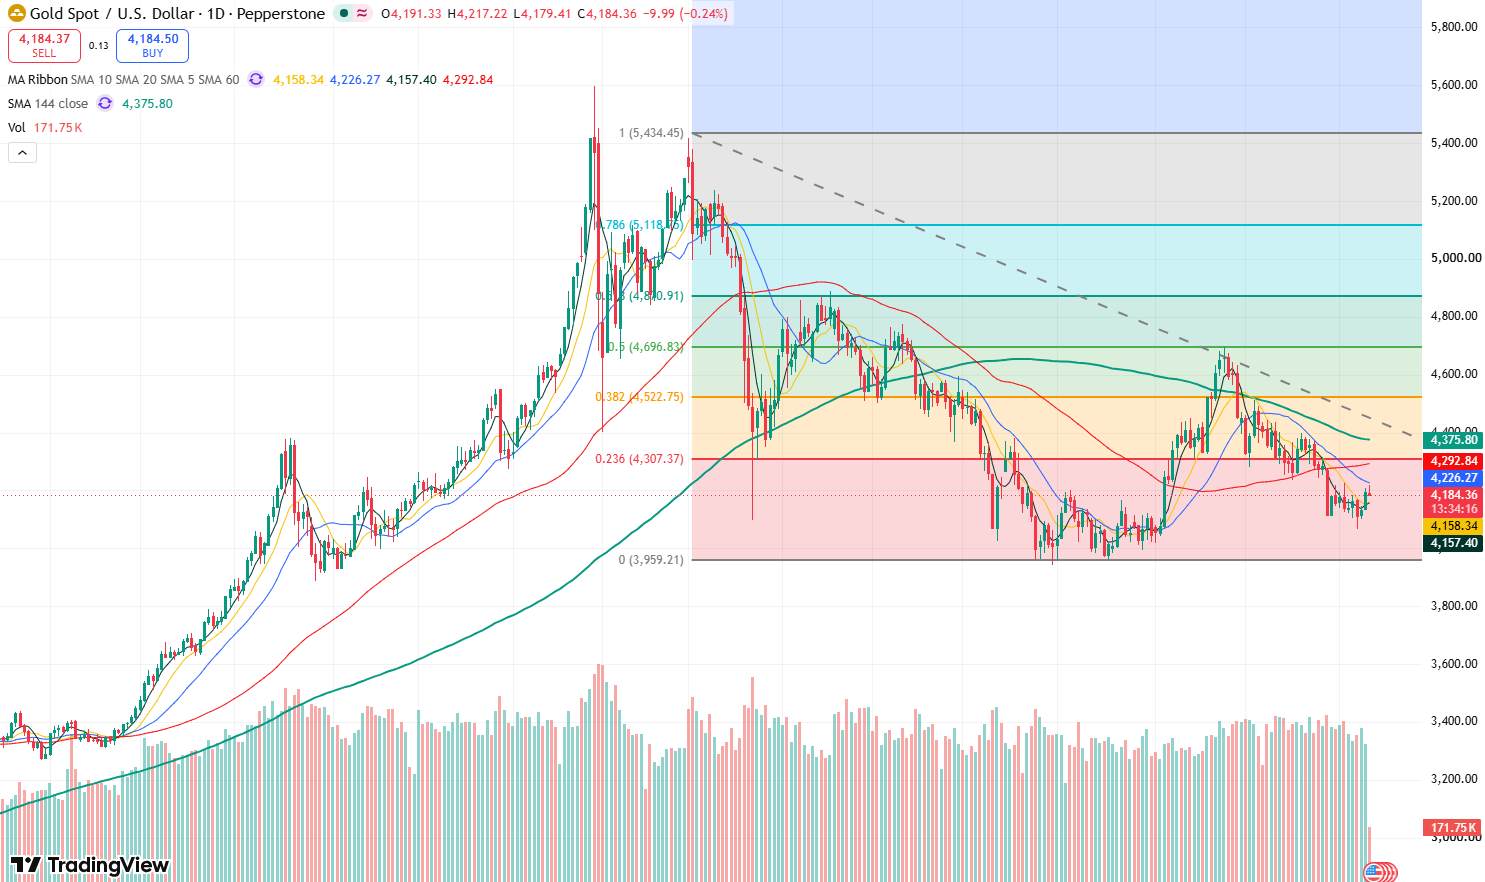
Gold price daily chart, Source: TradingView
Looking at gold's daily chart, prices rebounded sharply last week after finding support near $4,066, reclaiming the key round-number levels of $4,100 and $4,200, as short-term downside momentum waned. Meanwhile, last week's weekly chart formed a bullish candle with a long lower shadow, further bolstering short-term bullish momentum.
Currently, gold prices touched the 20-day moving average today, increasing short-term overhead resistance and potentially prompting a pullback toward $4,170. Traders can wait for the price to stabilize after the pullback before attempting to go long.
Regarding upside resistance, the primary resistance level to watch is near $4,230. A break above this level would expand upside space to $4,250, with the $4,300 mark further above. Holding firmly above $4,300 would open up upside room toward $4,400.
Regarding downside support, the primary support level to watch is near $4,170. If it breaks below this level, the next support to watch is near $4,150, followed lower by the $4,100 mark.
Recommended Articles


