


Crypto Today: Bitcoin, Ethereum, XRP stabilize defying macro headwinds and ETF outflows
- Bitcoin regains momentum, climbing back above $76,000 despite the Fed's 25-basis-point rate hike.
- Ethereum ticks up, aiming for a short-term $2,500 breakout even as ETF outflows reach $224 million.
- XRP sits above a moving-average support cluster but faces headwinds, as reflected in declining momentum indicators.
Bitcoin (BTC) is showing resilience, trading up above $76,000 on Thursday. The uptick follows the United States (US) Federal Reserve (Fed) decision that hiked interest rates the day before. Meanwhile, Ethereum (ETH) gains momentum toward $2,500, suggesting the return of bulls as macro headwinds settle. Ripple (XRP), on the other hand, remains stable, trading around $1.30, reinforced by short- to medium-term moving averages.
Fed rate hike largely priced
The Federal Open Market Committee (FOMC) unanimously raised interest rates by 25 basis points to a new range of 3.75%-4.00% on Tuesday, as widely expected. This marks the first rate hike in the world’s largest economy in over three years, since 2023 and the first rate move since Fed Chair Kevin Warsh took office in May.
Warsh maintained a hawkish tone in his post-meeting press conference, stressing the need for tighter monetary policy to curb inflation, which sits above the central bank’s 2% goal.
“The plain fact is that inflation is too high and has been for too long,” Warsh emphasized.
Markus Levin, Co-founder of XYO, said in an emailed comment that “the Fed’s growth outlook was revised higher, which suggests policymakers are not seeing an economy that is close to breaking. If inflation starts moving lower, there is still a path for the Fed to pause without needing to push rates materially higher.”
Bitcoin and Ethereum face combined $520 million ETF outflows
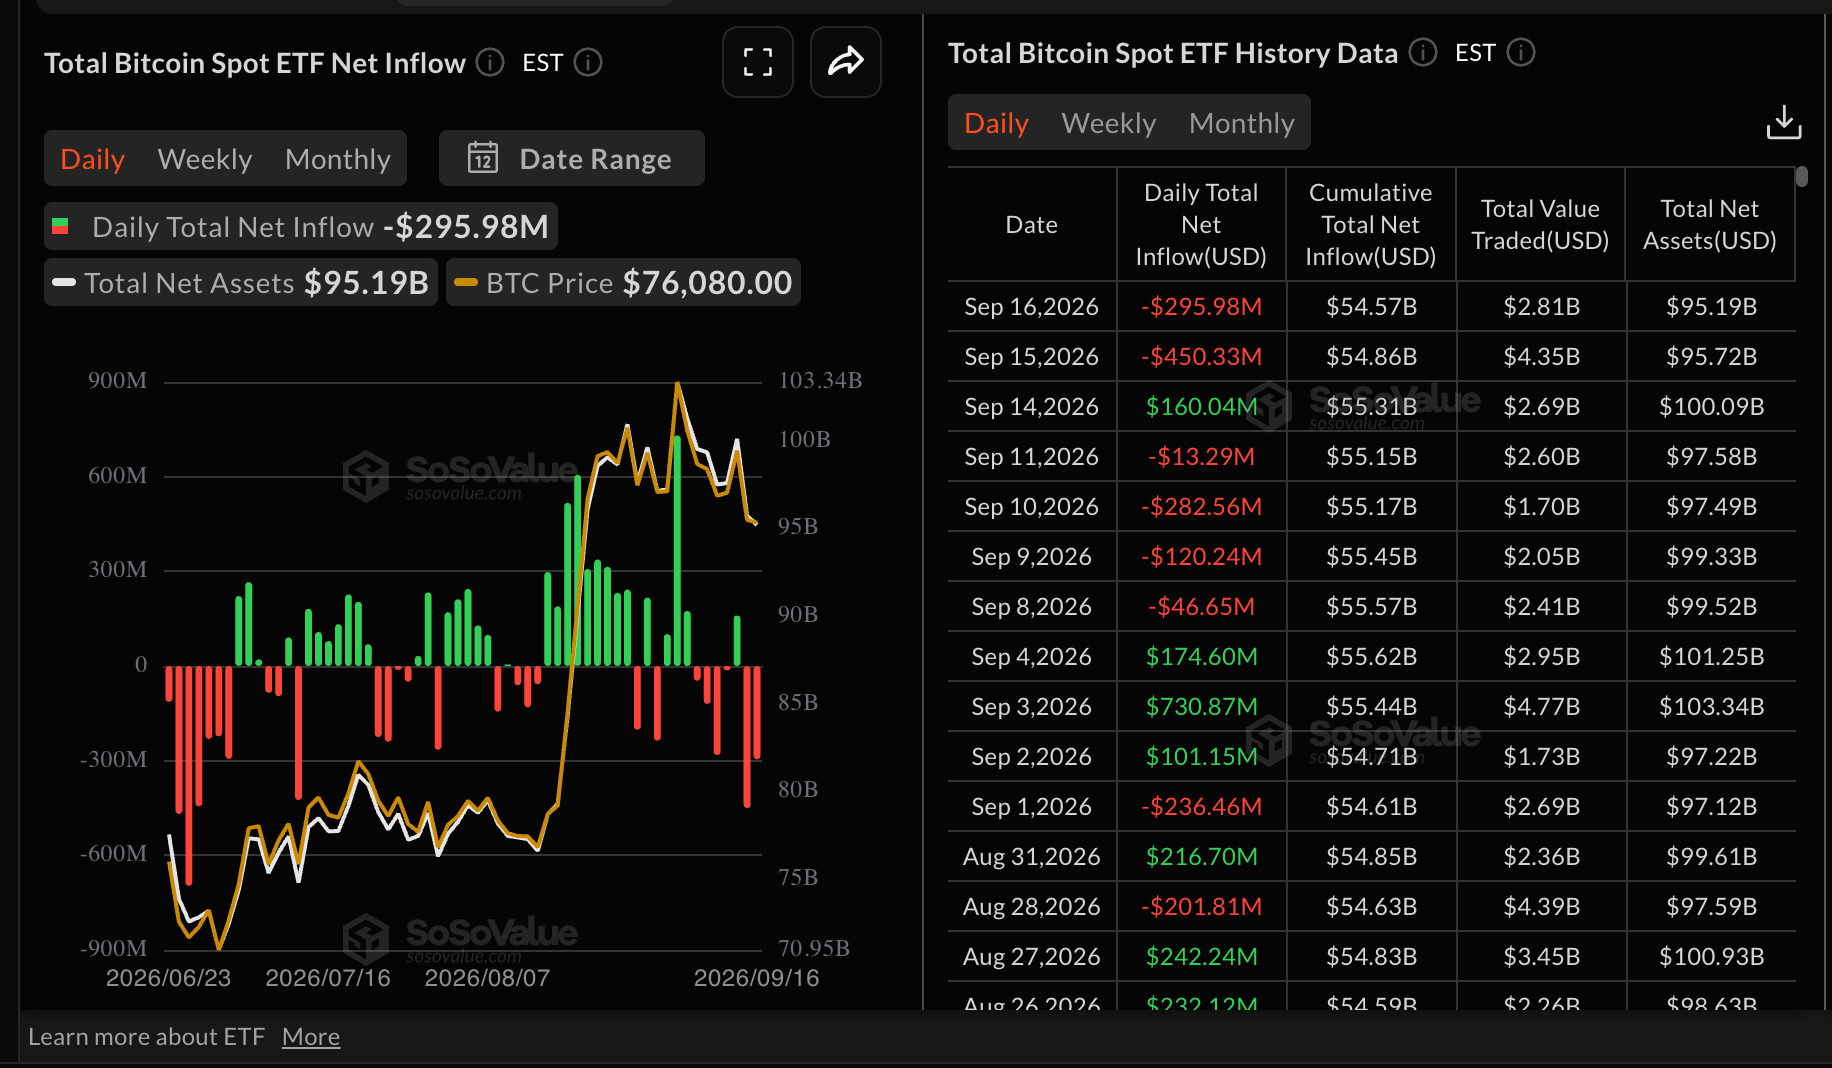
Bitcoin spot Exchange-Traded Funds (ETFs) extended a developing bearish streak, with $296 million in outflows on Wednesday. This fell short of the $450 million in outflows the previous day. Cumulative inflows now stand at nearly $55 billion, with net assets averaging $95 billion, suggesting that institutions still retain a long-term bullish outlook on Bitcoin.
“Bitcoin has already absorbed a significant amount of higher-rate expectations, and if yields stabilize, the asset can continue to trade on institutional demand and improving liquidity rather than simply on Fed policy,” Levin stated, adding, “if markets start pricing several additional hikes, that would put more pressure on risk-on assets.”
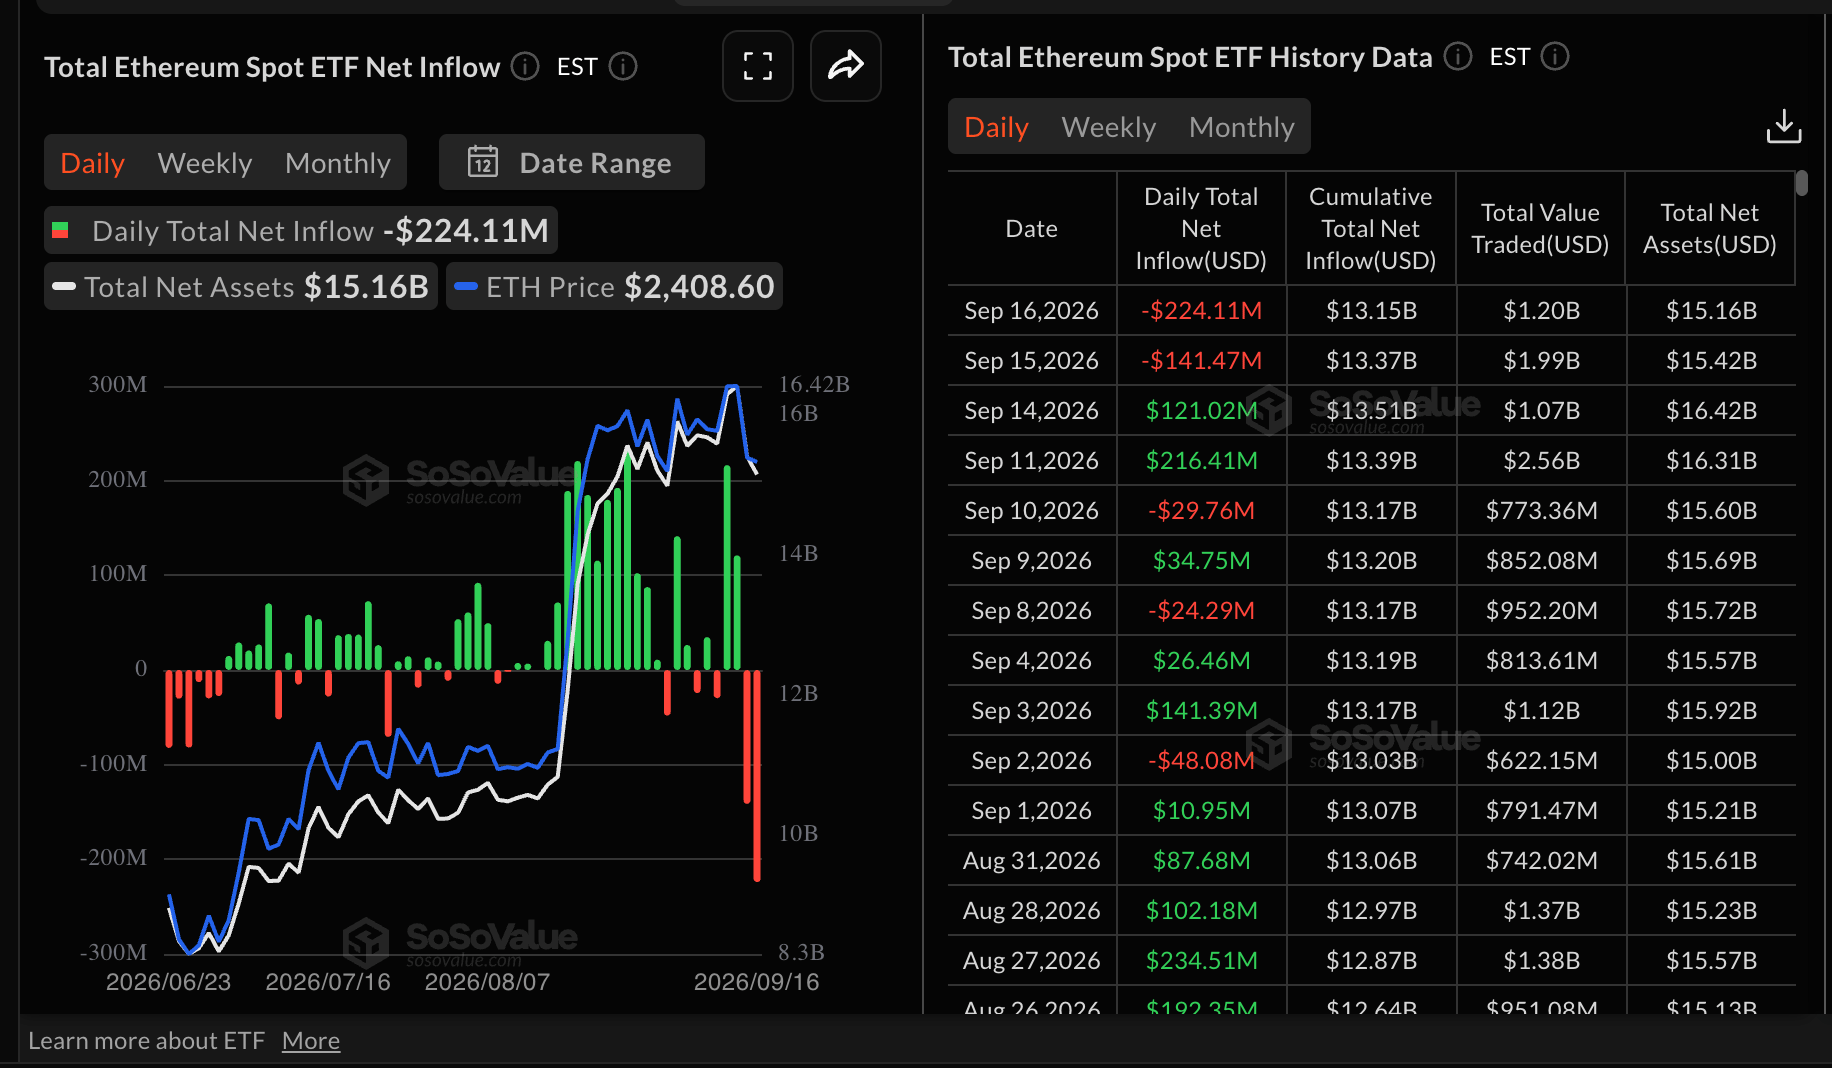
Ethereum spot ETFs similarly recorded outflows amounting to $224 million on Wednesday, higher than the previous day’s $141 million, according to SoSoValue. The smart contract token has attracted roughly $13 billion in cumulative inflows, with net assets under management at $15 billion, backing a long-term bullish picture despite the return of outflows.
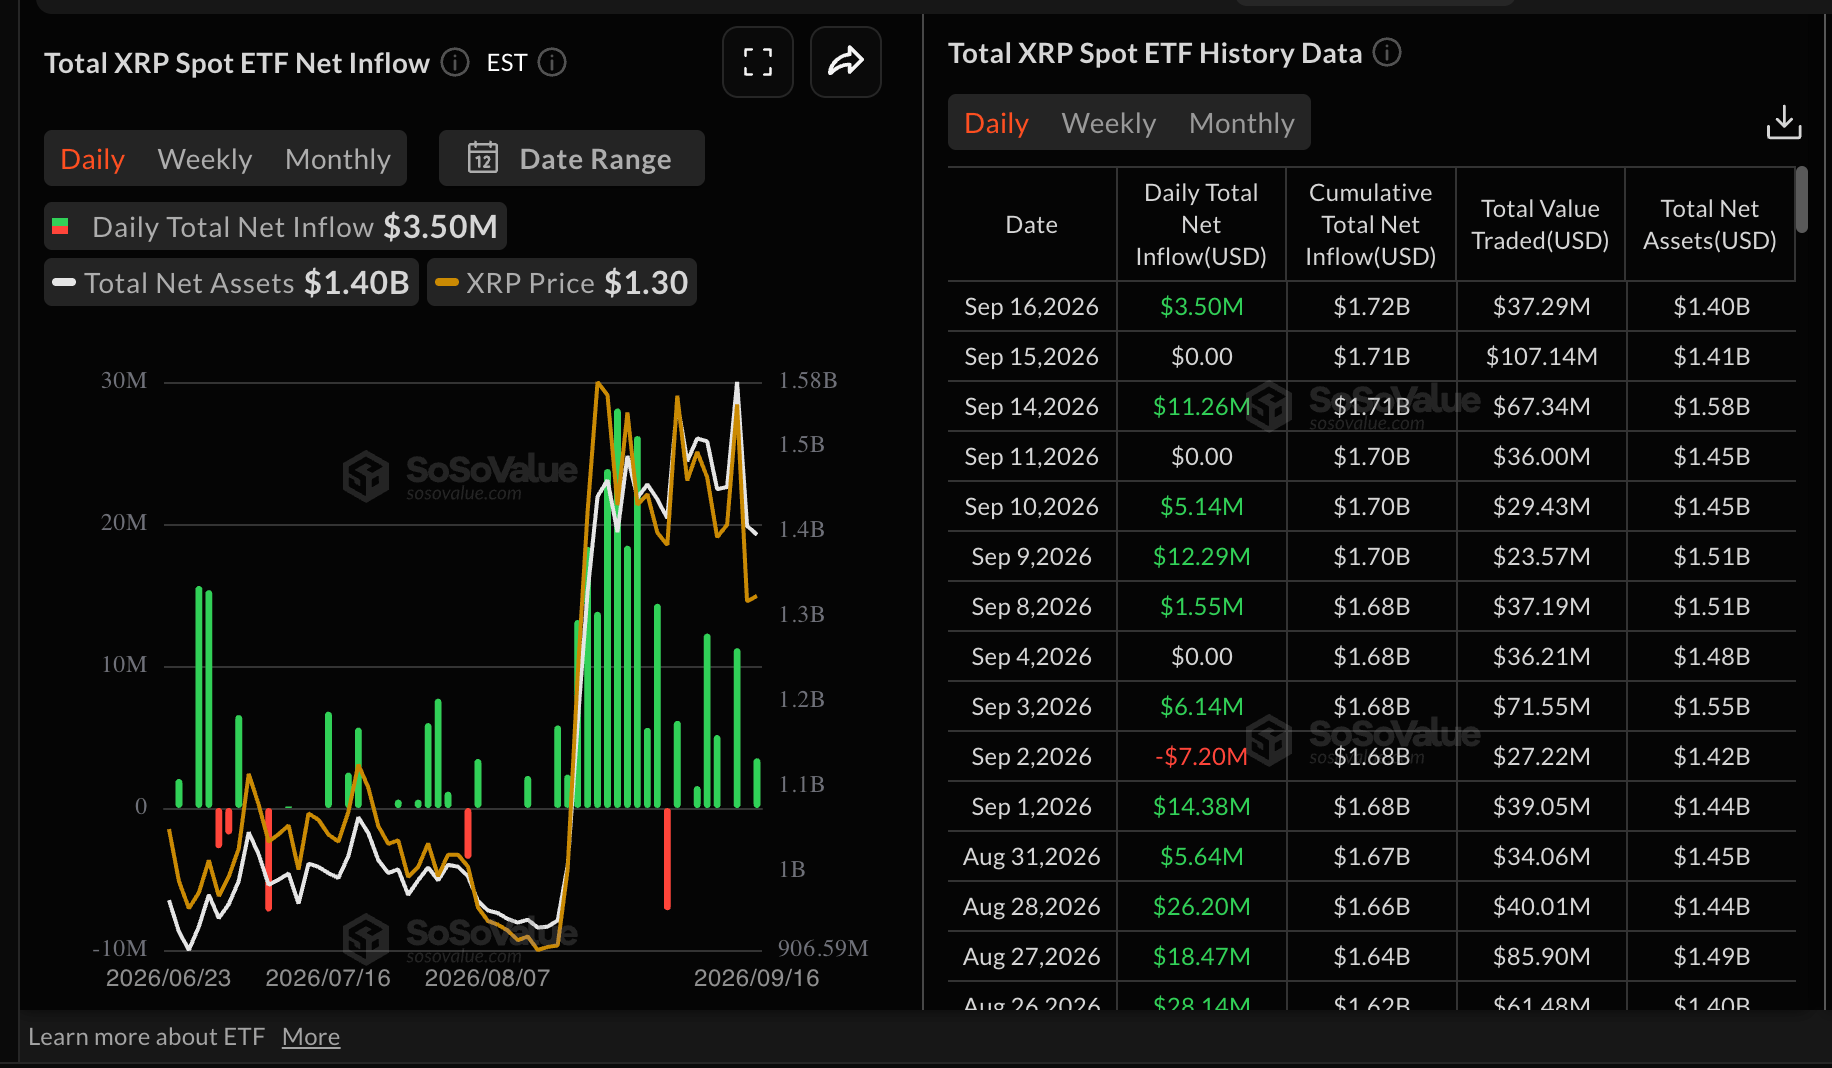
XRP spot ETFs defied market doldrums to post inflows of $3.5 million on Tuesday, after muted activity the day before. Cumulative inflows edged higher to $1.72 billion, with net assets falling slightly to $1.4 billion.
Technical analysis: Bitcoin steadies as support holds
Bitcoin edges higher above a psychological support level tested at $75,000. The largest cryptocurrency by market capitalization also holds a constructive near-term bias as price remains above the key Exponential Moving Averages (EMAs), all providing underlying demand.
The earlier breakout above the downtrend resistance line, now watched around $65,366, reinforces a medium-term bullish structure, although the Moving Average Convergence Divergence (MACD) indicator sits in negative territory, hinting at waning upside momentum while the Relative Strength Index (RSI) near 51 suggests neutral conditions.
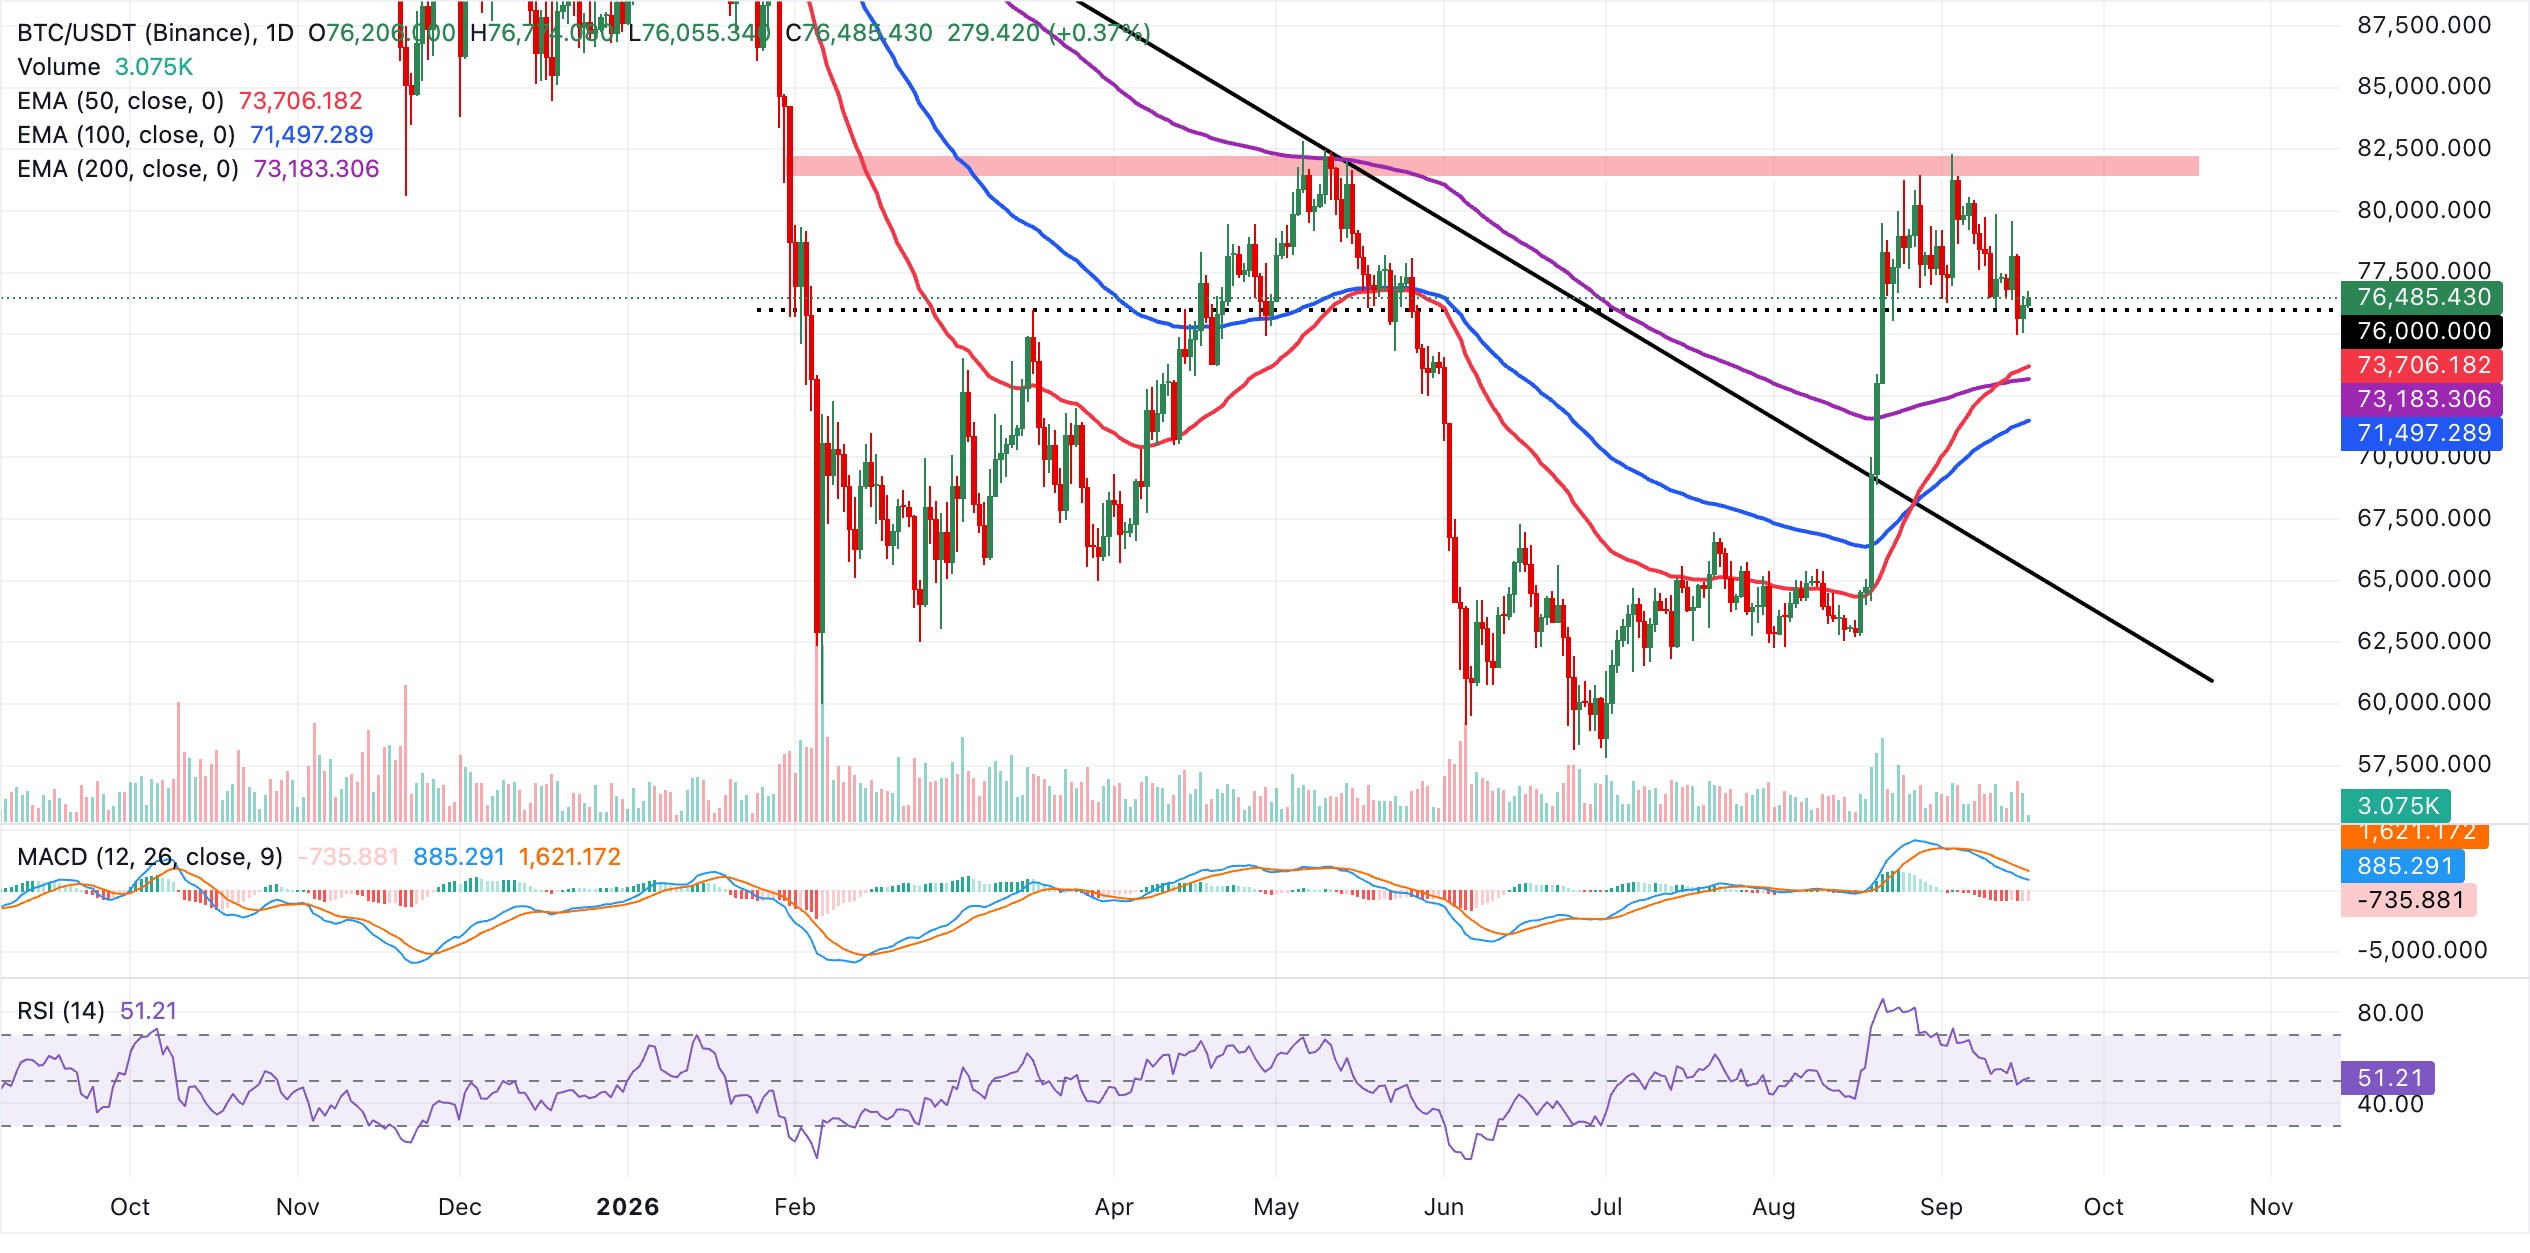
On the downside, immediate support is seen slightly below the current pivot zone near $76,000, followed by a dense technical cluster formed by the 50-day EMA at $73,706 and the 200-day EMA at $73,183, with the 100-day EMA at $71,497 underpinning the broader bullish trend.
A deeper pullback would likely attract buyers ahead of the former downtrend break level near $65,366. With no nearby technical resistance on the daily chart, further gains would likely meet the next meaningful supply in the $78,000-$80,000 range, leaving the bulls in control as long as the EMA cluster holds.
Altcoins technical outlook: Ethereum and XRP uphold neutral outlook
Ethereum holds a bullish near-term bias as price extends above the key EMAs, with the 50-day EMA at $2,283, the 100-day EMA at $2,162 and the 200-day EMA at $2,211 all trailing below current levels and reinforcing an underlying uptrend structure.
Still, momentum has cooled, with the MACD histogram in negative territory and the RSI hovering near 54, hinting at a more measured advance rather than aggressive upside acceleration.
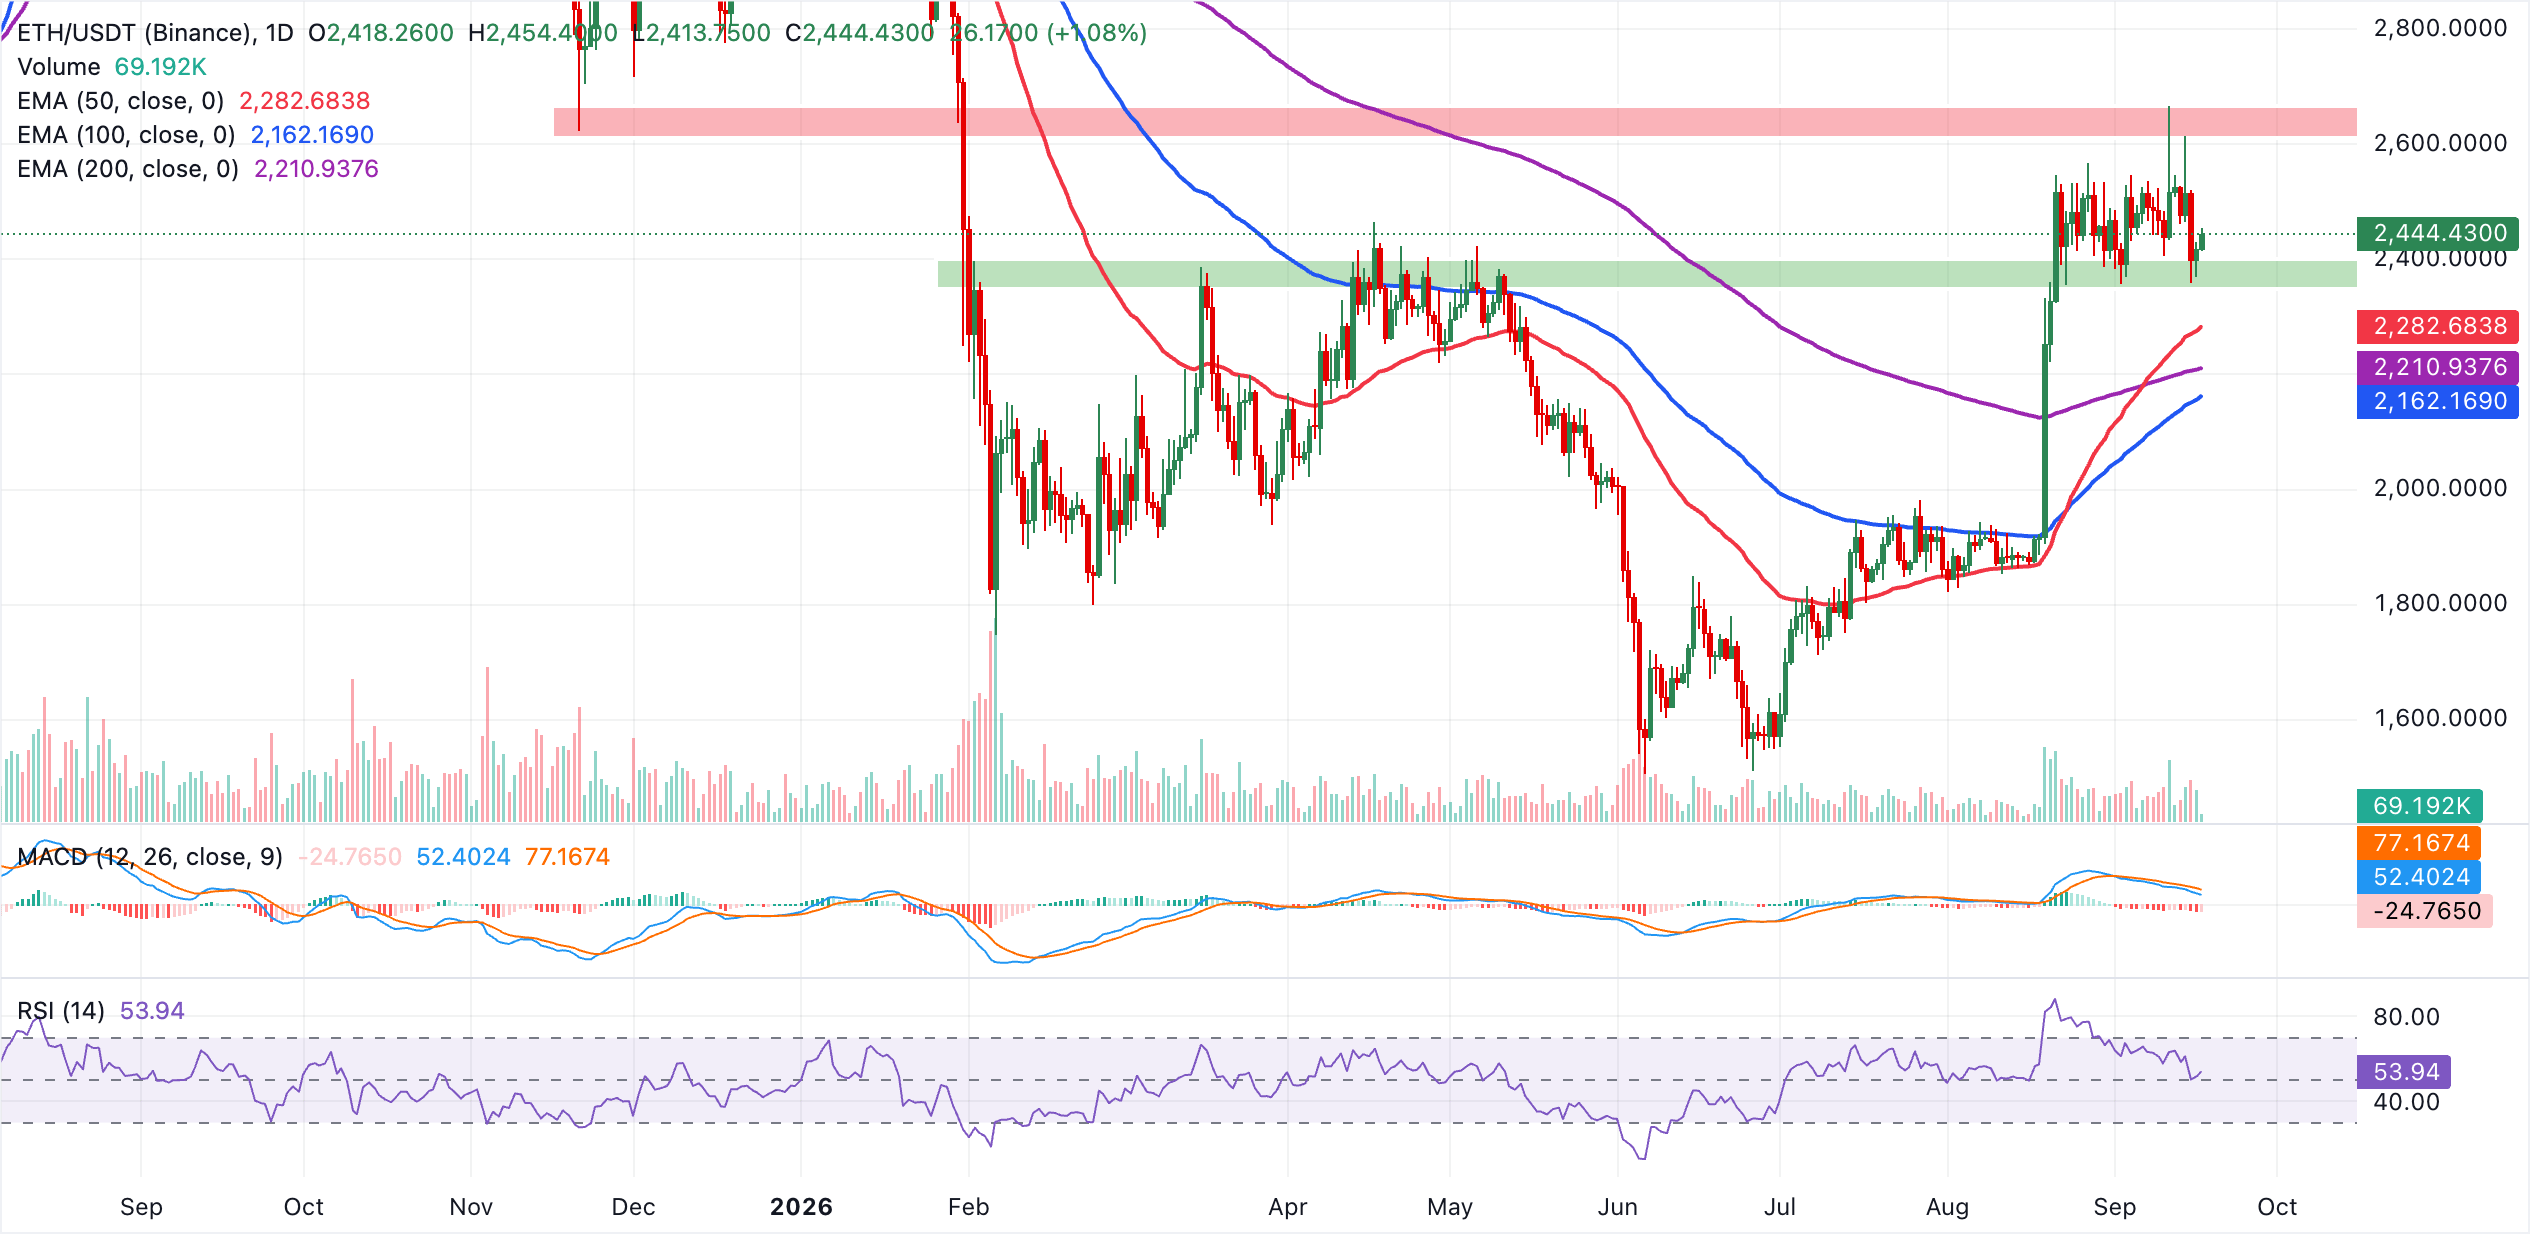
On the downside, immediate support sits at the 50-day EMA near $2,283, which would form the first dynamic floor if a pullback unfolds. Below that, the 200-day EMA at $2,211 and the 100-day EMA at $2,162.17 provide deeper demand layers expected to cushion a broader corrective phase. With no clear technical resistance levels on the daily chart, short-term bulls may continue to probe higher while respecting these clustered EMA supports as critical levels to maintain the current constructive structure.
XRP, meanwhile, trades at $1.30, moving toward the long-term 200-day EMA at $1.36, which now caps upside and keeps the near-term bias bearish. Price still holds above the 50-day EMA at $1.28 and the 100-day EMA at $1.26, suggesting a corrective pullback within a broader up-move rather than a full trend reversal. The MACD trades below zero with a negative reading and a subdued profile, while the RSI near 46 hints at fading bullish momentum and room for further consolidation or downside extension.
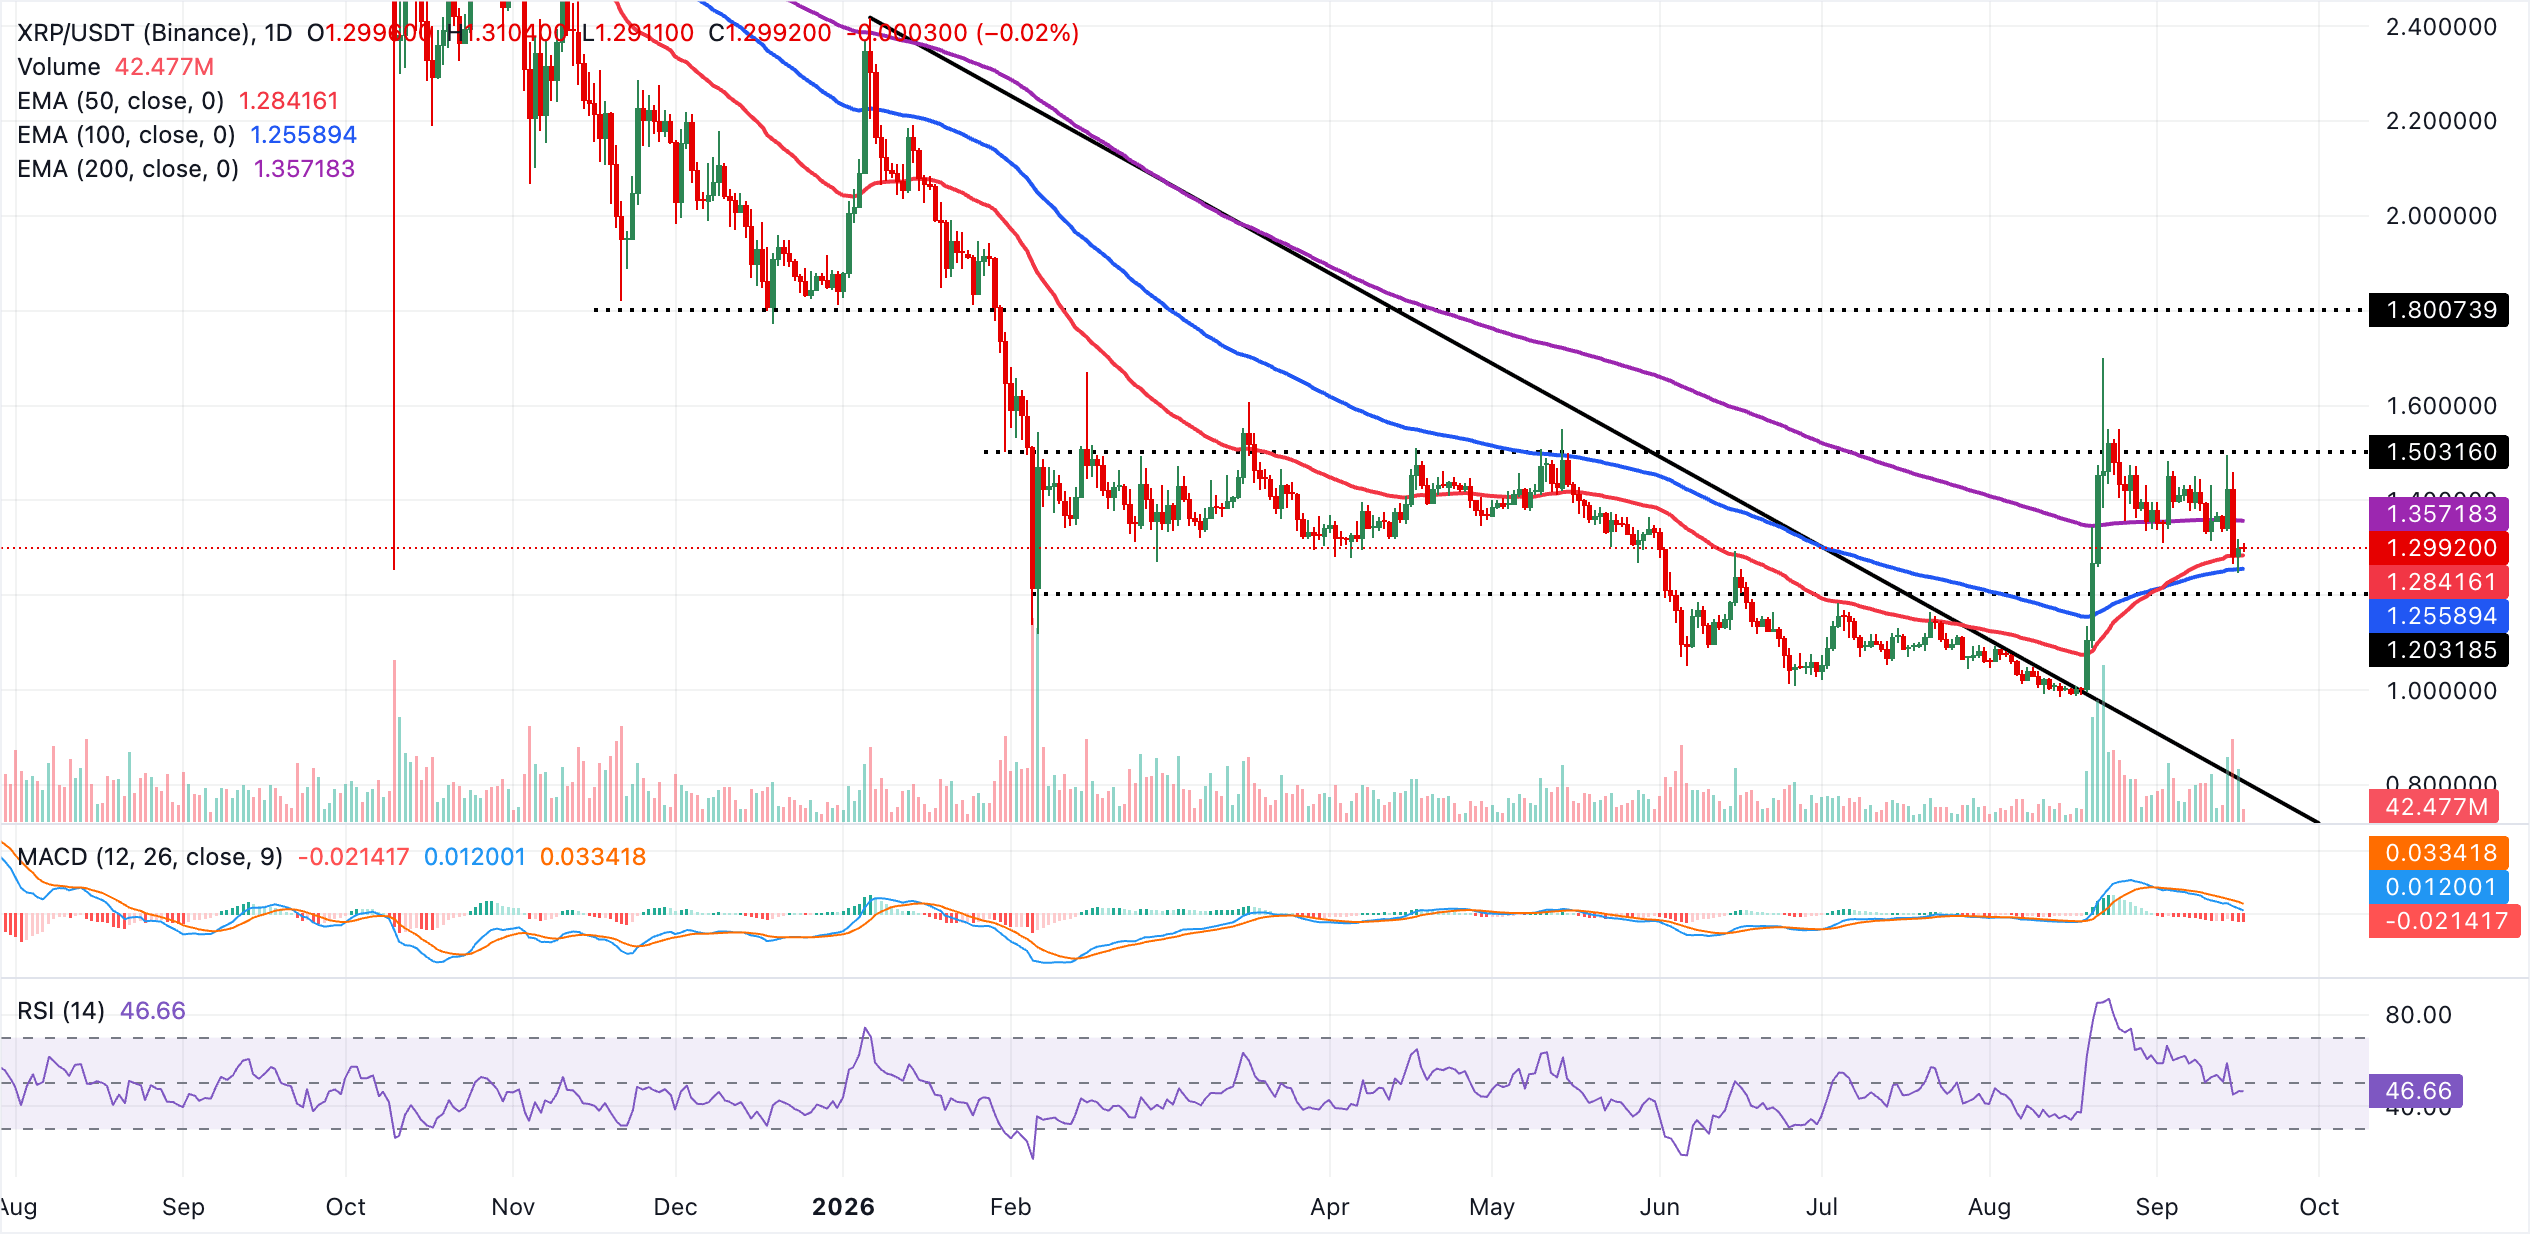
On the downside, immediate support lies at the 50-day EMA at $1.28, with a deeper floor at the 100-day EMA near $1.26, where buyers could attempt to defend the medium-term uptrend. On the topside, the 200-day EMA at $1.36 stands as the key resistance. A sustained break above this level would be needed to neutralize the current bearish bias and open the door toward higher highs in the coming sessions.
(The technical analysis of this story was written with the help of an AI tool. Know more.)
Bitcoin, altcoins, stablecoins FAQs
Bitcoin is the largest cryptocurrency by market capitalization, a virtual currency designed to serve as money. This form of payment cannot be controlled by any one person, group, or entity, which eliminates the need for third-party participation during financial transactions.
Altcoins are any cryptocurrency apart from Bitcoin, but some also regard Ethereum as a non-altcoin because it is from these two cryptocurrencies that forking happens. If this is true, then Litecoin is the first altcoin, forked from the Bitcoin protocol and, therefore, an “improved” version of it.
Stablecoins are cryptocurrencies designed to have a stable price, with their value backed by a reserve of the asset it represents. To achieve this, the value of any one stablecoin is pegged to a commodity or financial instrument, such as the US Dollar (USD), with its supply regulated by an algorithm or demand. The main goal of stablecoins is to provide an on/off-ramp for investors willing to trade and invest in cryptocurrencies. Stablecoins also allow investors to store value since cryptocurrencies, in general, are subject to volatility.
Bitcoin dominance is the ratio of Bitcoin's market capitalization to the total market capitalization of all cryptocurrencies combined. It provides a clear picture of Bitcoin’s interest among investors. A high BTC dominance typically happens before and during a bull run, in which investors resort to investing in relatively stable and high market capitalization cryptocurrency like Bitcoin. A drop in BTC dominance usually means that investors are moving their capital and/or profits to altcoins in a quest for higher returns, which usually triggers an explosion of altcoin rallies.
Recommended Articles


