


September Fed Rate Decision Preview: Is a Rate Hike a Foregone Conclusion? US Stocks, Dollar, and Gold Face a Critical Test

TradingKey - The Federal Reserve will announce its September interest rate decision at 2:00 p.m. ET on Wednesday (September 16), followed by a press conference held by Fed Chair Kevin Warsh at 2:30 p.m. The meeting will also release the latest economic projections and interest rate dot plot.
25-Basis-Point Hike Highly Likely as Focus Shifts to Number of Subsequent Hikes
The market's baseline expectation has clearly shifted toward a rate hike. According to the latest Reuters survey, about 85% of economists polled expect the Federal Reserve to raise interest rates by 25 basis points at its September meeting, lifting the target range for the federal funds rate from the current 3.50%-3.75% to 3.75%-4.00%. Interest rate futures reflect an approximately 90% probability of a 25-basis-point hike. If the Fed ultimately raises rates, it will mark its first rate increase in over three years.
The primary driver behind the rapidly heating rate-hike expectations is that recent U.S. employment and inflation data have failed to show clear support for easing. U.S. nonfarm payrolls increased by 162,000 in August, significantly higher than the market consensus expectation of 56,000, while the unemployment rate held steady at 4.1%. Although year-over-year wage growth slowed from 3.2% to 3.1%, the overall labor market continues to show strong resilience.
On the inflation front, August CPI rose 0.4% month-over-month and 3.4% year-over-year, while core CPI increased 0.3% month-over-month and 2.4% year-over-year. Meanwhile, August PPI rose 0.4% month-over-month, with its year-over-year growth rate further accelerating from 4.8% in July to 5.4%. The resurgence in energy prices, in particular, has heightened market concerns about inflation heating up again over the coming months.
From a market perspective, what could truly trigger significant market volatility at this meeting is not the decision on a 25-basis-point hike itself, but rather the dot plot and Warsh's statements regarding the future policy path.
Economic projections released in June showed that Fed officials expected the median federal funds rate to be 3.8% by the end of 2026, noticeably higher than the 3.4% projected in March, with a median rate of 3.6% by the end of 2027. If rates are raised by 25 basis points in September, the midpoint of the target range will rise to 3.875%, which is effectively close to or slightly above the June dot plot's projection for the end of 2026. Therefore, if the updated dot plot further raises the median rate forecast for the end of this year to around 4.1%, it would mean that a majority of officials likely see room for another 25-basis-point hike later this year; if it remains around 3.9%, it would align more closely with a "hike in September and monitor data" policy path.
In addition, clear divisions had already emerged within the Fed. The July meeting resulted in a 9-to-3 vote to maintain the rate range at 3.50%-3.75%, but three officials—Beth Hammack, Neel Kashkari, and Lorie Logan—supported a 25-basis-point hike at that time. This indicates that calls for further policy tightening were already present within the Committee prior to the release of the August employment and inflation data.
Therefore, investors need to closely monitor three key signals: first, whether the Fed raises rates by 25 basis points as expected; second, whether the end-2026 dot plot hints at another hike in December; third, whether Warsh emphasizes that inflation risks remain elevated and explicitly preserves the possibility of consecutive rate hikes. If the policy statement and press conference lean distinctly hawkish, the market could still upwardly revise future peak interest rate expectations, even if a 25-basis-point hike has already been fully priced in.
How the Fed Rate Decision Will Affect US Stocks, the Dollar and Gold
As for US equities, a 25-basis-point rate hike is currently fully priced in, so the primary risk for US stocks may stem from the dot plot and Warsh's policy statements, rather than the rate hike itself. As of September 15, the 10-year US Treasury yield had broken above 5%, reaching its highest level since 2007, while the S&P 500 Index and Nasdaq Composite Index have also been under pressure from rising interest rates recently. If the Federal Reserve raises interest rates by 25 basis points, but the dot plot shows only limited room for further tightening during the remainder of the year and emphasizes that future decisions will be data-dependent, valuation pressures on high-valuation tech stocks could ease; if the dot plot significantly raises the rate path for 2026 and 2027 while Warsh signals continued rate hikes, US Treasury yields could remain elevated or even rise further, exerting greater pressure on tech, semiconductor, and other high-valuation growth stocks. By contrast, some financial sectors such as banking and insurance may demonstrate relative resilience in a higher-rate environment; however, if long-term yields surge rapidly and trigger economic growth concerns, overall US equities could still come under pressure.
As for the US dollar, the greenback has recently been supported by Fed rate hike expectations and rising US Treasury yields. The latest Reuters data shows that the market has priced in an approximately 90% probability of a 25-basis-point rate hike; therefore, if the Fed only raises rates as expected while Warsh downplays the need for consecutive further hikes, the US dollar may experience a degree of "sell the fact" behavior; if the dot plot indicates that another rate hike in December remains possible and the policy rate forecast for 2027 is revised upward further, interest rate differential expectations between the US and major economies could widen, continuing to support the US dollar. Conversely, if the Fed unexpectedly leaves rates unchanged or explicitly hints that the September hike is a one-off adjustment, the US dollar could face more pronounced pullback pressure.
Gold Price Daily Chart, Source: TradingView
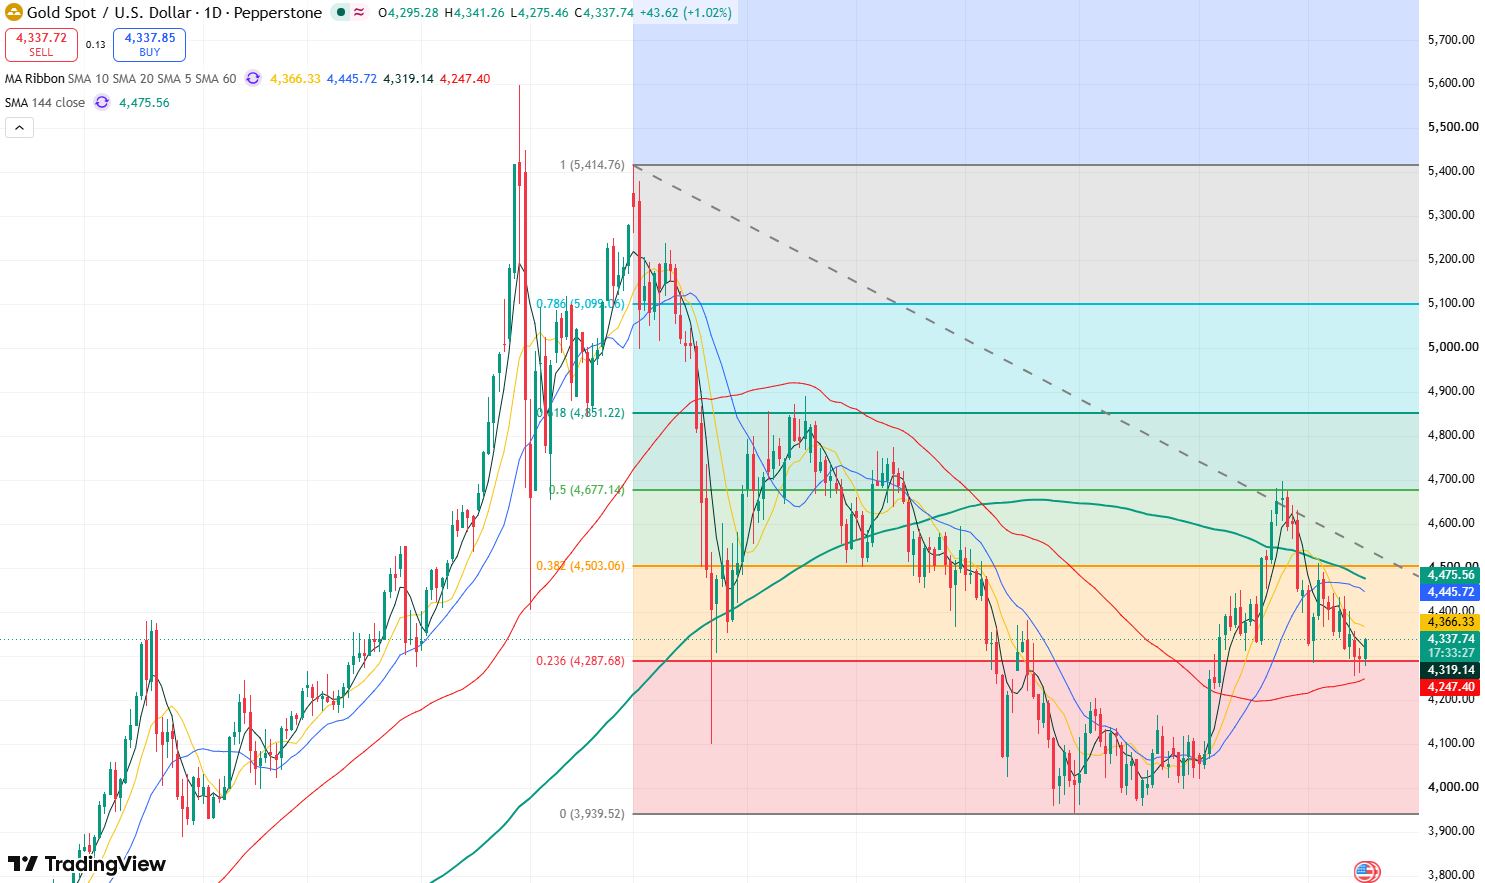
As for gold (XAUUSD), gold has recently been noticeably suppressed by a stronger US dollar and rising US Treasury yields. As of Wednesday's Asian trading session, gold prices were trading near $4,330, while the 10-year US Treasury yield had risen near its highest level since 2007. If the Fed raises interest rates by 25 basis points while the dot plot shows room for one or more additional rate hikes in the future, real interest rates and the US dollar could remain high, leaving the non-yielding asset gold under short-term pressure to test the $4,200 support level downward again.
However, as this rate hike has already been largely priced in by the market, if Warsh does not further reinforce expectations for consecutive rate hikes, the interest rate pressure facing gold may ease, pushing gold prices to rebound and potentially test the $4,510 resistance level upward.
If the Fed unexpectedly holds rates steady, or if the dot plot shows a higher probability of pausing rate hikes after September, US Treasury yields and the US dollar could pull back, providing relatively direct support for gold prices. The rebound momentum for gold would be significantly strengthened, with prices potentially testing the $4,700 level upward.
Read more
* The content presented above, whether from a third party or not, is considered as general advice only. This article should not be construed as containing investment advice, investment recommendations, an offer of or solicitation for any transactions in financial instruments.


