

Bitcoin SV Price Forecast: BSV hits three-month high, eyeing 200-day EMA breakout

Source Fxstreet
  • Bitcoin SV extends gains on Friday, testing the bullish breakout of the 200-day EMA at $15.39.
  • Retail strength holds firm with BSV futures Open Interest rising 5% in 24 hours amid positive funding rates.
  • The technical outlook for BSV is bullish as upside momentum builds.

Bitcoin SV (BSV) is up nearly 2% on Friday, extending a steady upward trend over the last two weeks. Retail strength builds in BSV amid multiple vulnerabilities found in the Bitcoin ecosystem. Bitcoin SV’s technical outlook is bullish as the price tests an upside breakout above the 200-day Exponential Moving Average (EMA) at $15.39.

Is Bitcoin SV regaining its retail strength?

Bitcoin SV shows mild strength in near-term retail demand following the recent vulnerabilities found in the Bitcoin ecosystem, including the Coldcard wallet hack and roughly 8,000 issues found by Bitcoin Red Team, a volunteer group of developers, using the Kimi K3 AI model. 

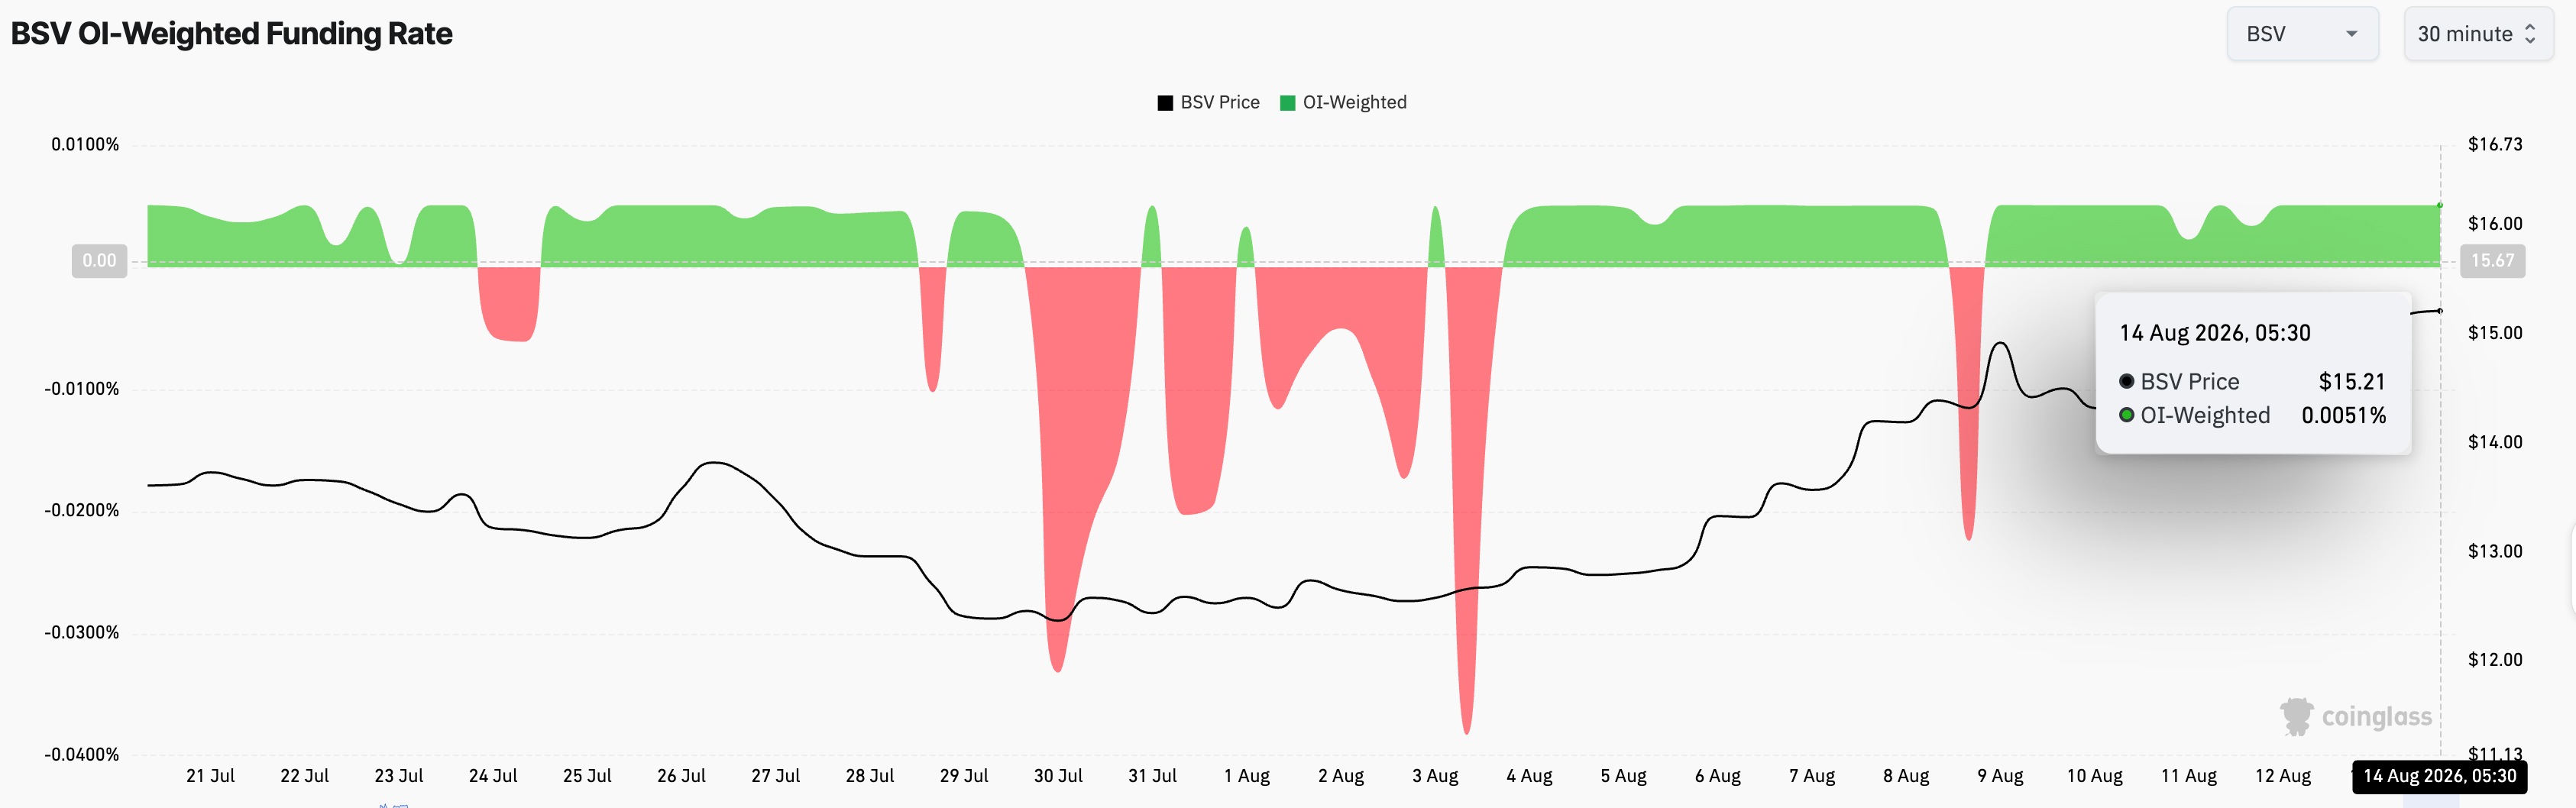
Buzz around the PiWalletSV, an air-gapped wallet for the Bitcoin SV ecosystem, adds to the retail strength. CoinGlass data shows the BSV futures Open Interest (OI) is at $38.54 million, up from $31.87 million on August 1, indicating a surge in positional buildup. At the same time, the funding rate holds stable at 0.0051%, reflecting a steady demand for long positions.
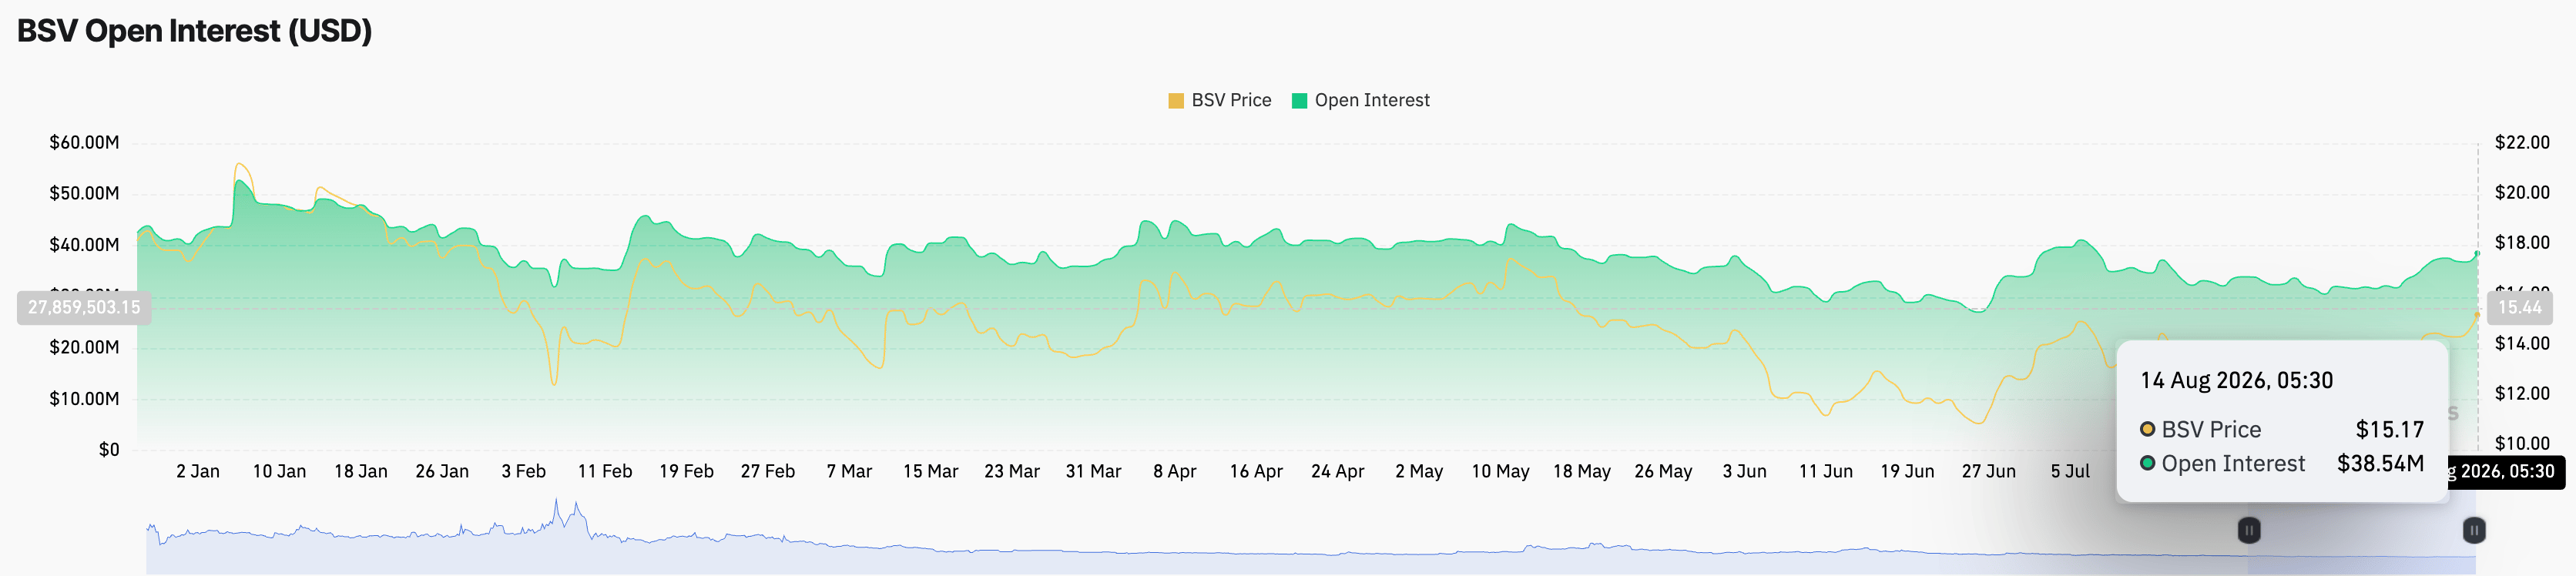
BSV Open Interest data. Source: CoinGlass
BSV funding rate data. Source: CoinGlass

Technical outlook: Will BSV price clear the 200-day EMA barrier?

Bitcoin SV trades at around $15.35 on Friday, holding a bullish near-term bias as price extends above the 50-day EMA at $13.57 while still capped just beneath the 200-day EMA at $15.39. From a technical perspective, the rebound in BSV from the $10.69 support level on June 25 suggests a possible trend reversal.

For a sustained recovery, BSV must clear the 200-day EMA at $15.39, followed by the $17.06 resistance marked by the December 28 low, which capped gains multiple times earlier this year.

The Moving Average Convergence Divergence (MACD) and its signal line rise into positive territory on the daily chart, hinting at positive momentum. At the same time, the Relative Strength Index (RSI) at 73 signals overbought conditions that could slow further upside movement.

BSV/USDT daily price chart.

On the downside, initial support is seen at the 50-day EMA at $13.57, where a pullback would still leave the broader recovery structure intact. However, a bearish breakout could threaten the $10.69 support level.

(The technical analysis of this story was written with the help of an AI tool. Know more.)

Disclaimer: For information purposes only. Past performance is not indicative of future results.
placeholder
Financial Markets 2026: Volatility Catalysts in Gold, Silver, Oil, and Blue-Chip Stocks—A CFD Trader's OutlookGet a comprehensive financial market 2026 outlook exploring key economic drivers, volatility catalysts in gold, oil and stocks, and what the evolving economic outlook means for cfd trading strategies and risk management on global markets.
Author  Rachel Weiss
May 15, Fri
Get a comprehensive financial market 2026 outlook exploring key economic drivers, volatility catalysts in gold, oil and stocks, and what the evolving economic outlook means for cfd trading strategies and risk management on global markets.
placeholder
Gold Price Forecast: Cooling Rate Hike Expectations Push Gold Above $4,400, Eyeing $4,500 Next As of the European session on August 11, gold prices (XAUUSD) briefly topped $4,400 intraday, reaching a high of $4,435.2, its highest level since June 5. However, gains subsequently narr
Author  TradingKey
Aug 11, Tue
As of the European session on August 11, gold prices (XAUUSD) briefly topped $4,400 intraday, reaching a high of $4,435.2, its highest level since June 5. However, gains subsequently narr
placeholder
WTI declines below $82.50 as oil inventories rise far more than expectedWest Texas Intermediate (WTI), the US crude oil benchmark, is trading around $82.45 during the early Asian trading hours on Thursday. WTI declines on a larger-than-expected build in US crude oil inventories. Traders will closely monitor the developments surrounding US-Iran talks for fresh impetus. 
Author  FXStreet
Yesterday 01: 24
West Texas Intermediate (WTI), the US crude oil benchmark, is trading around $82.45 during the early Asian trading hours on Thursday. WTI declines on a larger-than-expected build in US crude oil inventories. Traders will closely monitor the developments surrounding US-Iran talks for fresh impetus. 
placeholder
Forex Today: US Dollar stabilizes ahead of next batch of US dataHere is what you need to know on Thursday, August 13:
Author  FXStreet
21 hours ago
Here is what you need to know on Thursday, August 13:
placeholder
WTI remains below $80.50 as traders monitor diplomatic efforts to reopen HormuzWest Texas Intermediate (WTI) oil price remains subdued for the third successive day, trading around $80.30 per barrel during the Asian hours on Friday. Crude oil prices edge lower as investors adopt a wait-and-see approach, closely monitoring diplomatic attempts to reopen the Strait of Hormuz.
Author  FXStreet
6 hours ago
West Texas Intermediate (WTI) oil price remains subdued for the third successive day, trading around $80.30 per barrel during the Asian hours on Friday. Crude oil prices edge lower as investors adopt a wait-and-see approach, closely monitoring diplomatic attempts to reopen the Strait of Hormuz.
Related Instrument
goTop
quote