


Is Bitcoin Headed for a Breakdown or a Breakout? The Historical Evidence Is Just Too Overwhelming to Ignore.
Key Points
Bitcoin has historically been a highly volatile asset, prone to drawdowns of up to 94%.
Since its launch in 2009, Bitcoin has traded in four-year cycles of boom and bust.
While past history is no guarantee or predictor of future performance, the evidence suggests that Bitcoin will turn things around in 2027.
- 10 stocks we like better than Bitcoin ›
Perspectives on where Bitcoin (CRYPTO: BTC) is headed next tend to vary wildly. Some investors think Bitcoin is headed for a further breakdown and could fall all the way to zero. Others think that Bitcoin is on the cusp of a major breakout and could reach $1 million by 2030.
So which is it? Is Bitcoin headed for a breakdown or a breakout? Fortunately, I believe there is enough historical evidence to answer that question.
Missed Nvidia in 2009? This Rare Signal Is Flashing Again. In 2009, a "Double Down" signal flashed for a little-known chipmaker called Nvidia. For the first time in years, that same "Total Conviction" signal is flashing for a company 1/100th the size of Nvidia. Continue »
Bitcoin's history of breakdowns
Bitcoin has historically been a highly volatile asset, capable of wild price swings on a daily, weekly, monthly, and annual basis. Throughout its history, in fact, Bitcoin has suffered several major breakdowns.
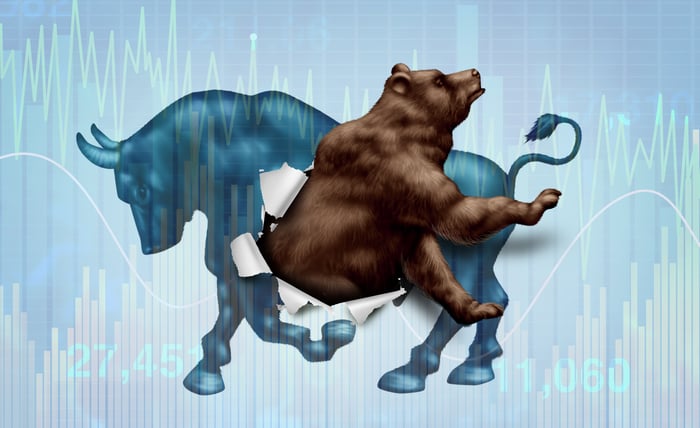
Image source: Getty Images.
The worst of these occurred in 2011, when Bitcoin lost 94% of its value, falling from $30 to roughly $2. Bitcoin also suffered a major breakdown in 2018, losing 83% of its value in about 11 months. And nearly the same phenomenon occurred in 2022, when Bitcoin lost 76% of its value in one year.
The good news is that Bitcoin's breakdowns have become less severe over time. Thus, there's reason to think that Bitcoin may have already bottomed. At one point this year, Bitcoin was trading at a 54% discount to its all-time high set in 2025. The drawdowns continue to shrink from one cycle to the next.
Bitcoin's history of breakouts
The reason investors have returned to Bitcoin, again and again, is its long history of breakouts. Often, Bitcoin can turn on a dime, delivering a spectacular year out of left field.
By the end of 2022, for example, Bitcoin had fallen all the way to $16,000, and many thought it had still further to fall. All anyone could talk about was the "crypto winter" and how nobody would ever invest in Bitcoin again.
But in 2023, Bitcoin broke out. It soared 156% in value. Then, to prove this wasn't a fluke, it rose by another 121% in 2024. That was two straight years of triple-digit returns. That set Bitcoin up nicely for 2025, when it reached a new all-time high of $126,000.
The same historical boom-and-bust phenomenon has now recurred so many times that it's almost impossible to deny the classic Bitcoin four-year cycle. There are three really good years, followed by one bad year. That's why when Bitcoin hit a new all-time high of $126,000 in 2025, it seemed unlikely to have a winning year in 2026. To be fair, 2025 ended with a drawdown and the traditional pattern is off by a couple of months. Still, Bitcoin is close to fulfilling the normal cycle.
Based on the above, the answer to the "Breakdown or breakout?" question seems clear. Bitcoin may have already bottomed and is now arguably in recovery mode at $63,380 per coin on Aug. 13. I wouldn't be at all surprised if Bitcoin makes a spectacular year-end rally to reclaim the $100,000 price level. An extended crash would be a shock, though.
But here's the big caveat: Don't expect the rally to be a smoothly upward-sloping line. It's likely to be filled with peaks and valleys, with no clear short-term signal. Typically, it is only after an extended period that Bitcoin's upward march becomes clear.
So, if you're investing in Bitcoin now, be sure to fasten your seat belt for a potentially volatile ride ahead.
Should you buy stock in Bitcoin right now?
Before you buy stock in Bitcoin, consider this:
The Motley Fool Stock Advisor analyst team just identified what they believe are the 10 best stocks for investors to buy now… and Bitcoin wasn’t one of them. The 10 stocks that made the cut could produce monster returns in the coming years.
Consider when Netflix made this list on December 17, 2004... if you invested $1,000 at the time of our recommendation, you’d have $400,209!* Or when Nvidia made this list on April 15, 2005... if you invested $1,000 at the time of our recommendation, you’d have $1,375,393!*
Now, it’s worth noting Stock Advisor’s total average return is 964% — a market-crushing outperformance compared to 215% for the S&P 500. Don't miss the latest top 10 list, available with Stock Advisor, and join an investing community built by individual investors for individual investors.
See the 10 stocks »
*Stock Advisor returns as of August 14, 2026.
Dominic Basulto has positions in Bitcoin. The Motley Fool has positions in and recommends Bitcoin. The Motley Fool has a disclosure policy.
Recommended Articles


