


Gold Price Forecast: Cooling Rate Hike Expectations Push Gold Above $4,400, Eyeing $4,500 Next

 Trending Articles
- Gold Price Forecast: Gold Rises as Nonfarm Payrolls Unexpectedly Turn Negative; Can CPI and PPI Help Break $4,500?
- Hormuz tensions escalate as unconfirmed missile attack amid fragile US-Iran talks
- Gold Price Forecast: Can Gold Still Rise Above $4,300 Ahead of July Non-Farm Payrolls?
- Gold rallies to two-week high as USD softens on Iran deal hopes, receding Fed hike bets
- Australian Dollar remains calm following Trade Balance data
- WTI holds firm near $77.50 as escalating Middle East tensions threaten oil supply routes

TradingKey - As of the European session on August 11, gold prices (XAUUSD) briefly topped $4,400 intraday, reaching a high of $4,435.2, its highest level since June 5. However, gains subsequently narrowed significantly as gold pulled back to around $4,360. Gold has been consistently strong recently, with the core driver being market expectations of further Federal Reserve rate hikes waning following a cooling U.S. labor market. Nevertheless, an intraday rise in crude oil prices reignited inflation concerns, causing gold to face noticeable profit-taking above $4,400.
Cooling Fed Rate-Hike Expectations Boost Gold, But Rising Oil Limits Gains
From a fundamental perspective, the core factor driving the recent sustained rise in gold prices is the significant cooling of market expectations for a Fed rate hike in September. US July nonfarm payrolls unexpectedly dropped by 23,000, far below the market expectation of an 80,000 increase. The weak employment data led investors to reassess the prospects for the US economy and the Federal Reserve's policy outlook. Currently, market expectations for a September rate hike have fallen to near 50%, noticeably lower than levels prior to the nonfarm payrolls release. Falling rate-hike expectations have weighed on the US dollar and Treasury yields, providing strong support for gold and driving gold prices to further break above $4,400 in Asian trading today, hitting a new two-month high.
However, gold pulled back from above $4,400 during European trading hours, indicating that the market has not fully entered a one-sided bullish mode. The main pressure facing gold prices stems from a rebound in international crude oil prices. After negotiations between the US and Iran over a peace agreement and the reopening of navigation in the Strait of Hormuz hit a stalemate, the market priced back in Middle East crude supply risks, driving oil prices sharply higher. Higher oil prices once again sparked investor concerns over a rebound in US inflation, while pushing up US Treasury yields and renewing buying interest in the US dollar, causing non-yielding gold to retreat from high levels.
At present, the gold market is trading on two opposing narratives. On the one hand, weak nonfarm payrolls suggest a cooling US labor market and a diminished need for the Fed to raise interest rates further, which is bullish for gold. On the other hand, the situation in the Strait of Hormuz has caused oil prices to rise again. If energy prices continue to climb and push US inflation higher once more, the Fed may still keep the option of raising rates on the table. Consequently, US Treasury yields and the US dollar could rebound, thereby limiting upside potential for gold.
Therefore, the upcoming release of US July CPI data will be key to the trajectory of gold prices. If the CPI continues to show cooling inflation—especially if core inflation comes in lower than expected—the market may further pare back expectations for a Fed rate hike in September. A pullback in the US dollar and Treasury yields would favor gold in retesting $4,400 and pushing further toward $4,500. Conversely, if rising oil prices have already begun to feed into inflation and the CPI comes in unexpectedly higher than anticipated, the market could ramp up rate-hike bets again, potentially causing a more pronounced high-level correction in gold.
Gold Price Technical Analysis
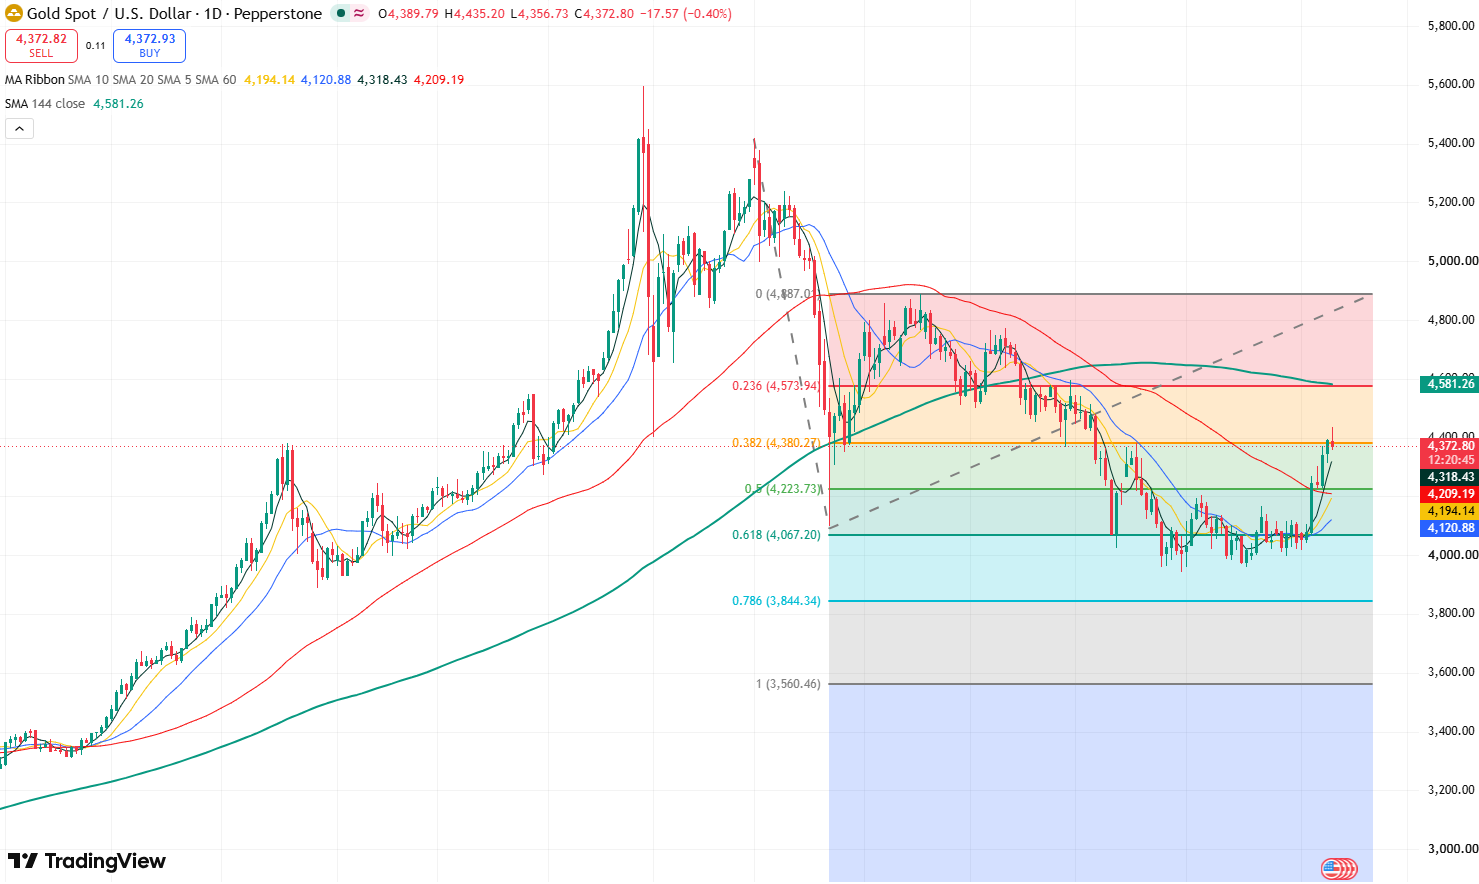
Gold price daily chart, Source: TradingView
Looking at gold's daily chart, prices have continued to rebound from $4,000 recently, briefly rising above the $4,400 mark intraday today with a bounce of over $400, indicating that short-term market sentiment leans bullish. Meanwhile, as gold broke above the June 17 rebound high of $4,382.15, its bullish momentum was further reinforced.
Currently, gold has broken through the key resistance level of $4,380, further opening up upside room and potentially testing the $4,500 level. If gold breaks and holds above the $4,500 level, it may further test the $4,600 level.
On the downside, the primary support to watch below is $4,360, located near the 10-period SMA on the 4-hour gold chart. Further down, attention turns to the $4,300 level; if this level fails to hold, gold may retreat further toward the support near $4,220.
Read more
* The content presented above, whether from a third party or not, is considered as general advice only. This article should not be construed as containing investment advice, investment recommendations, an offer of or solicitation for any transactions in financial instruments.


