

Cardano Price Forecast: Bulls eye a second leg higher as whales buy

Source Fxstreet
  • Cardano trades above $0.196 on Monday after a double-digit surge in the previous two weeks.
  • Santiment data shows whale wallets accumulating ADA, signaling growing demand.
  • Derivatives metrics show mixed sentiment with a slight bullish tilt, suggesting upside momentum could build further.

Cardano (ADA) trades above $0.196 at the start of the week on Monday after posting double-digit gains over the past two weeks. ADA’s bullish price action is supported by steady whale accumulation. Meanwhile, derivatives sentiment is showing a slight bullish tilt, suggesting a second leg higher for ADA.

Whales continue to accumulate

Santiment’s Supply Distribution data shows that large-wallet holders (whales) are steadily buying ADA, a move that supports the positive outlook for the token.

The metric indicates that whales holding between 1 million and 10 million ADA tokens (yellow line) and 10 million and 100 million ADA tokens (blue line) have accumulated a total of 110 million ADA tokens since Friday. This buy-the-dip scenario signals continued long-term interest among large-wallet holders and supports the ongoing price rally.

Cardano supply distribution metric chart. Source: Santiment

Derivatives metrics show a slight bullish tilt

Cardano’s derivatives metrics show strengthening conditions. CoinGlass’ OI-Weighted Funding Rate data for ADA flipped positive on Saturday, reading 0.0038% on Monday. This positive rate indicates that longs are paying shorts and projects a bullish sentiment.
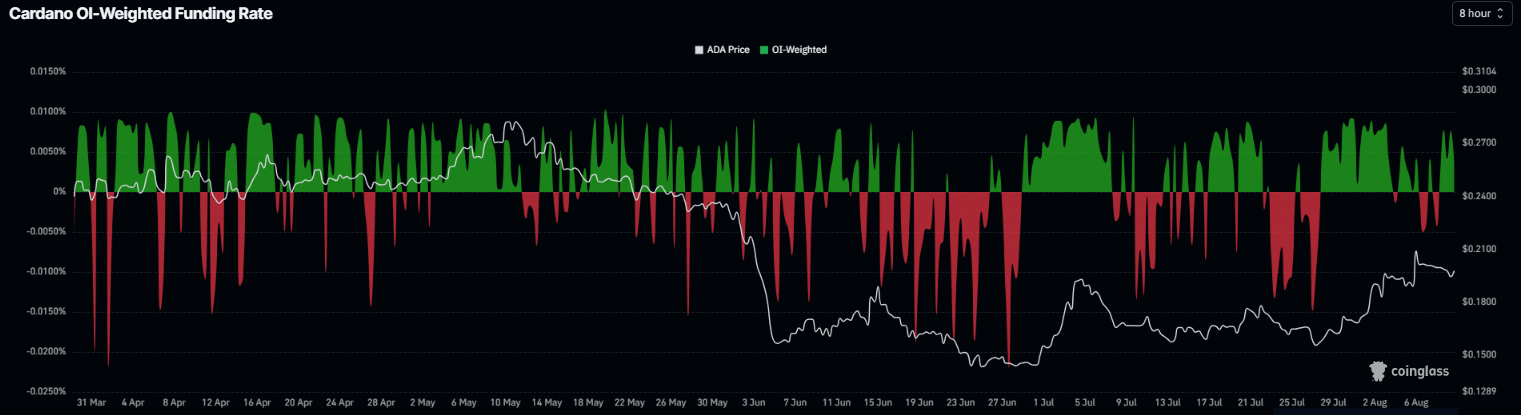
Cardano funding rates chart. Source: Coinglass

Meanwhile, Cardano’s long-to-short ratio is moving toward the neutral 1 level, reading 0.99 on Monday, suggesting that bearish sentiment is fading. A reading above 1 would indicate that long positions outnumber short positions, signaling a shift toward bullish sentiment.
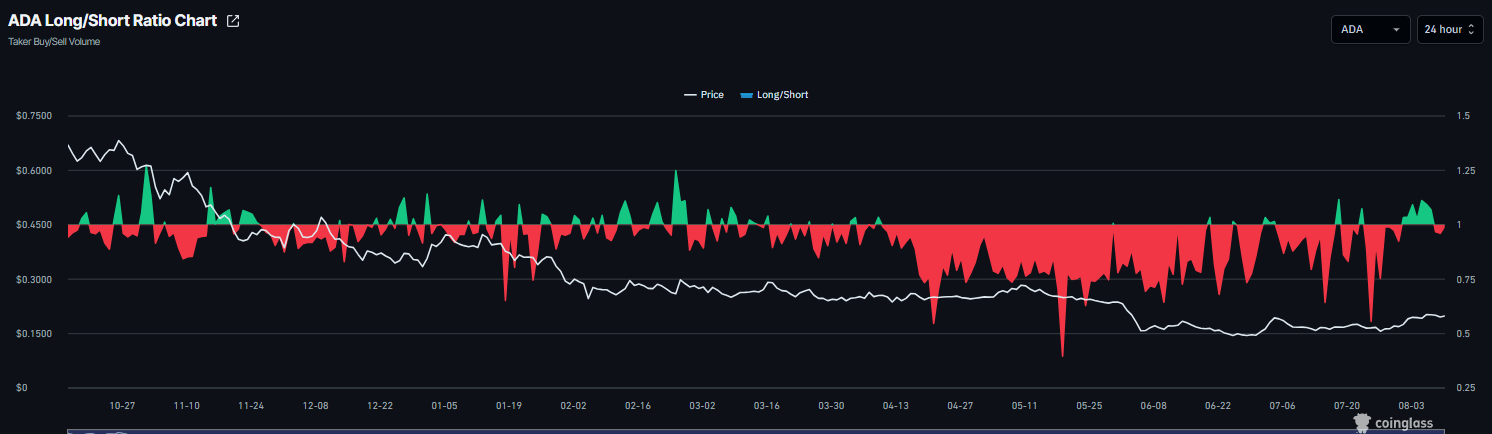
Cardano long-to-short ratio chart. Source: Coinglass

CryptoQuant’s summary data also shows a mild bullish tilt. Cardano’s futures markets show large whale orders with neutral conditions in other metrics, supporting a potential upside.
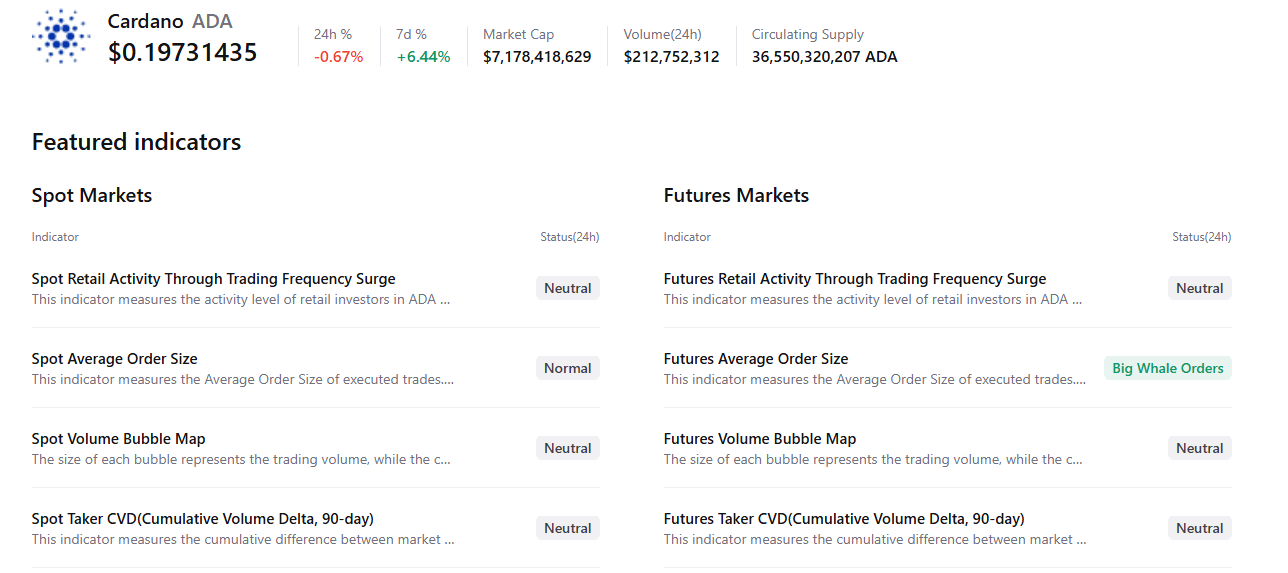
Cardano summary chart. Source: CryptoQuant

Cardano technical outlook: Bulls hold key support zone

Cardano price trades at $0.196 on Monday, keeping a mild positive near-term tone as price holds above the 50-day Exponential Moving Average (EMA) at $0.180. However, it remains below the 100-day EMA at $0.196 and the 200-day EMA at $0.254. 

The reclaim of the 38.2% Fibonacci retracement at $0.195 and the break above the downward trendline trigger at $0.176 hint at a developing recovery, while a firm Relative Strength Index (RSI) around 64 and a positive Moving Average Convergence Divergence (MACD) reading reinforce improving bullish momentum despite the broader overhead supply.

On the topside, immediate resistance is located at the 100-day EMA around $0.196, followed by the 50% retracement at $0.213 and the 61.8% Fibonacci retracement level near $0.231, with additional barriers at the horizontal cap of $0.236 come into play; a sustained break above this cluster would be needed to ease the broader bearish structure and expose the higher horizontal hurdle at $0.2991.

On the downside, initial support is seen at the 38.2% Fibonacci retracement around $0.195, ahead of the 50-day EMA at $0.180 and the former trendline break area near $0.176. In comparison, deeper losses would bring the 23.6% Fibonacci retracement at $0.173 and the horizontal floor at $0.150 into focus.
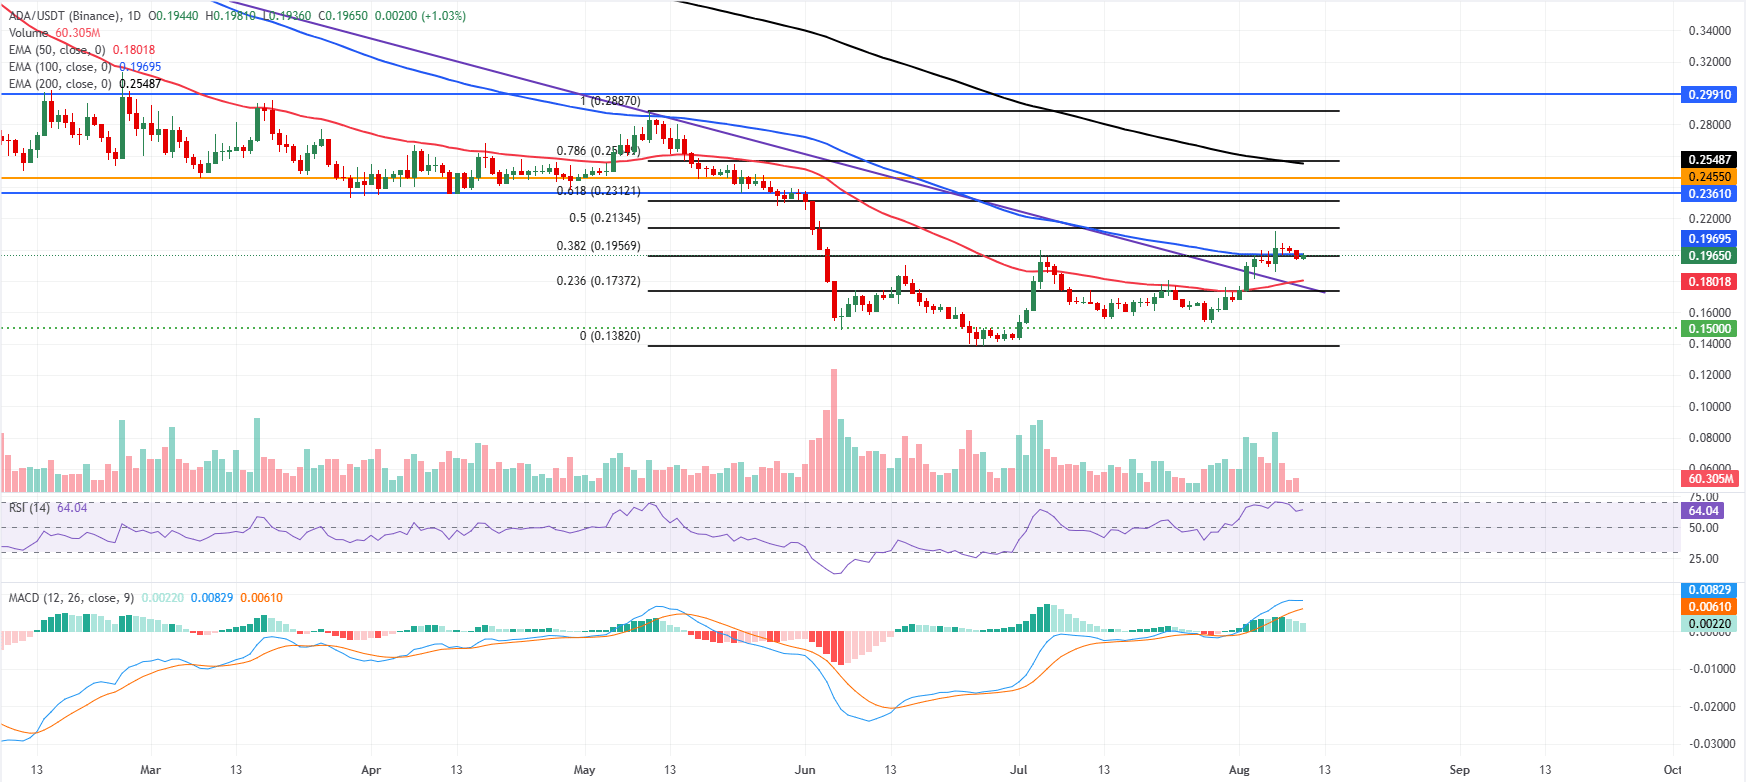
ADA/USDT daily chart

(The technical analysis of this story was written with the help of an AI tool. Know more.)

Disclaimer: For information purposes only. Past performance is not indicative of future results.
placeholder
Gold Price Analysis Today | Forex Gold Analysis | XAU/USD Analysis - October 20, 2026Get the latest gold price analysis, forex gold insights, and XAU/USD analysis for October 20, 2026. Read on for the details.
Author  Mitrade
Oct 20, Tue
Get the latest gold price analysis, forex gold insights, and XAU/USD analysis for October 20, 2026. Read on for the details.
placeholder
Dollar presses 102 as the 10-year yield sits at 5.14% — and October hike odds are only 17%The dollar index closed at 101.99 (+0.20%) on Monday after briefly topping 102.07, while the 10-year Treasury yield rose to 5.14% and the 2-year hit 4.774% — yet futures price only about a 17% chance of a hike at the October 27-28 FOMC, versus roughly 90% for December. The driver is a global bond selloff, not a Fed repricing: France's 10-year OAT jumped to 4.84% ~ 4.94% and the OAT-Bund spread widened to 140 ~ 146bp. Here are the levels, the cross-asset read-through and what to watch.
Author  Irene Q.
Oct 20, Tue
The dollar index closed at 101.99 (+0.20%) on Monday after briefly topping 102.07, while the 10-year Treasury yield rose to 5.14% and the 2-year hit 4.774% — yet futures price only about a 17% chance of a hike at the October 27-28 FOMC, versus roughly 90% for December. The driver is a global bond selloff, not a Fed repricing: France's 10-year OAT jumped to 4.84% ~ 4.94% and the OAT-Bund spread widened to 140 ~ 146bp. Here are the levels, the cross-asset read-through and what to watch.
placeholder
Gold Price Analysis Today | Forex Gold Analysis | XAU/USD Analysis - October 22, 2026Get the latest gold price analysis, forex gold insights, and XAU/USD analysis for October 22, 2026. Read on for the details.
Author  Mitrade
Yesterday 01: 58
Get the latest gold price analysis, forex gold insights, and XAU/USD analysis for October 22, 2026. Read on for the details.
placeholder
The Fed will sit still on October 28 — but 100 of 100 economists now expect a December hikeA Reuters poll run October 16-20 found 94 of 100 economists expecting the Fed to hold at 3.75-4.00% on October 28 — and all 100 expecting a hike in December, against less than half a month earlier. The market is close to the same price, with CME FedWatch at roughly 17% for October and 82.8% for December. With the Fed in blackout since October 17, here are the five dates that decide the rest of the year, what each one is priced for, and the two directions each can take.
Author  Irene Q.
Yesterday 06: 28
A Reuters poll run October 16-20 found 94 of 100 economists expecting the Fed to hold at 3.75-4.00% on October 28 — and all 100 expecting a hike in December, against less than half a month earlier. The market is close to the same price, with CME FedWatch at roughly 17% for October and 82.8% for December. With the Fed in blackout since October 17, here are the five dates that decide the rest of the year, what each one is priced for, and the two directions each can take.
placeholder
Gold Price Analysis Today | Forex Gold Analysis | XAU/USD Analysis - October 23, 2026Get the latest gold price analysis, forex gold insights, and XAU/USD analysis for October 23, 2026. Read on for the details.
Author  Mitrade
5 hours ago
Get the latest gold price analysis, forex gold insights, and XAU/USD analysis for October 23, 2026. Read on for the details.
Related Instrument
goTop
quote