


South Korean Stock Volatility Rarely Surpasses Bitcoin; Kospi vs. BTC: Which Is Better Investment?
KOSPI Volatility Crushes Bitcoin
TradingKey - Recently, Bloomberg and market data showed that the annualized volatility of the Korea Composite Stock Price Index (KOSPI) reached as high as 63%, not only far exceeding the stock markets of Japan, Pakistan, and Indonesia, but also shattering the conventional wisdom that cryptocurrency volatility must be higher than that of equities. Over the same period, Bitcoin ( BTC) volatility was only around 48%, far lower than the KOSPI index.
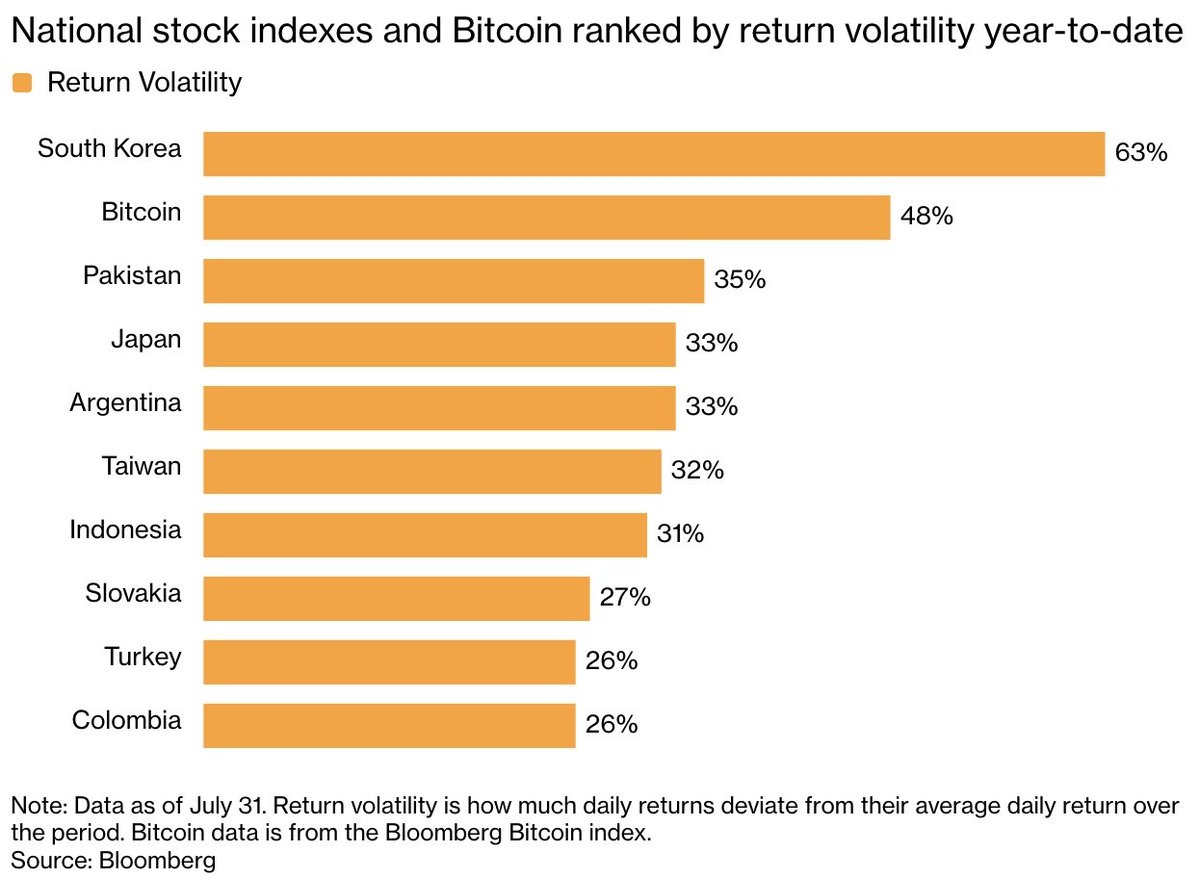
In response, economist Steve Hanke posted on the social media platform X stating that South Korea's benchmark stock index has become the most volatile in the world, and remarked that 'South Korea, as an artificial intelligence leader, clearly flew too high, and the result is reaping what it sowed.'
Why KOSPI Volatility Is Surpassing Bitcoin
The KOSPI Index's volatility exceeding that of Bitcoin is not only due to AI and single-stock leveraged ETFs, but also relates to the dampening of Bitcoin's own volatility. In the first half of this year, the market frantically chased the AI wave, driving related concept stocks to surge, whereas in the second half, skepticism gradually crept in, triggering stock price collapses. Among them, Samsung Electronics and SK Hynix ( SKHY) are prime examples. Together with their affiliates, these two companies account for more than 50% of the KOSPI's total market capitalization, meaning that any fluctuation in the AI sector leads to dramatic surges or plunges in South Korea's benchmark index.
On this basis, the South Korean market has launched a large number of 2x leveraged long/inverse ETFs tracking single stocks such as Samsung and SK Hynix or the KOSPI Index, further exacerbating stock market volatility. According to statistics, the trading volume of leveraged ETFs combined with their corresponding underlying stocks once accounted for more than 70% of the KOSPI's total daily turnover.
Historically, Bitcoin's annualized volatility has consistently run as high as 80%-100%, and even higher in extreme cases. However, with the popularization of spot Bitcoin ETFs, the deep involvement of Wall Street market makers, and the implementation of global regulatory compliance, Bitcoin is rapidly institutionalizing as an asset class. Its volatility curve has actually flattened significantly in recent years, with its typical annualized volatility mostly converging to the 40%-50% range, and its volatility profile is gradually aligning with high-beta U.S. tech stocks.
How Do KOSPI and Bitcoin Fundamentals Differ?
The KOSPI and Bitcoin represent two underlying asset logics of completely different dimensions: the former is a sovereign stock market highly concentrated in physical industries and cyclical sectors, while the latter is a decentralized, transnational digitally scarce asset and macro liquidity-absorbing asset. The specific differences are as follows:
Dimension | KOSPI | Bitcoin |
Underlying Asset Attributes | Equity in physical enterprises, AI/semiconductor hardware supply chain | Decentralized digital assets, macro hedging, and digital gold consensus |
Source of Value | Corporate operating profits, HBM/DRAM product sales, and cash flows | Programmatic scarcity, global liquidity premium, and network consensus |
Downside Moat | Tangible assets, low P/E valuation protection, government market stabilization funds | No tangible liquidation value, relying entirely on market liquidity and HODL demand |
Key Risk Factors | Liquidation of retail leveraged long positions, slowdown in AI capital expenditure, geopolitics | Fed tightening/global liquidity contraction, regulatory policy shifts |
How Investors Should Allocate: KOSPI vs. Bitcoin Deployment Strategies
From the perspective of volatility alone, the KOSPI is more suitable for spot short-term investors, as high and frequent volatility aligns better with the trading logic of short-term traders, making it easier to identify buy and sell points. Furthermore, if they get the direction of their bet right, the returns can be more substantial. However, if the direction of the bet is opposite to market movements, the resulting losses will also be greater.
For long-term investors, those worried about the continuation of the AI bubble should avoid the KOSPI and turn to Bitcoin instead. If the AI bubble is largely over, and they are optimistic about the semiconductor hardware manufacturing dividends under the global wave of AI upgrades, they should allocate to the KOSPI. However, it is not an either-or choice for investors, who can also allocate to both simultaneously in different proportions, such as 30% KOSPI + 70% Bitcoin, 70% KOSPI + 30% Bitcoin, or a 50/50 split.
Conclusion
The KOSPI's annualized volatility has recently soared to 63%, in a rare move surpassing Bitcoin's 48%. This is primarily because AI concept stocks like Samsung and SK Hynix account for over half of the KOSPI's market capitalization, coupled with single-stock leveraged ETFs amplifying the fluctuations. In contrast, Bitcoin's volatility has significantly narrowed with the rollout of spot ETFs and growing institutionalization. The KOSPI represents cyclical semiconductor physical assets, making it suitable for short-term trading, whereas Bitcoin is a decentralized digital asset suitable for long-term hedging. Investors can make decisions based on AI trends or use them for portfolio allocation.
Recommended Articles


