

GBP/JPY Price Forecast: Rebound holds above 200-day SMA

Source Fxstreet
  • GBP/JPY recovers 200-day SMA after sliding to 211.47.
  • Upside remains capped by 100- and 50-day SMA resistance.
  • Break below 211.91 exposes 211.00 and 209.58 support.

The British Pound retreats against the Japanese Yen, down about 0.24%, as the Yen is poised to end the week on a higher note. However, GBP/JPY is poised to finish the week with minimal gains, trading at 212.64.

GBP/JPY Price Forecast: Technical outlook

The GBP/JPY trades sideways, though slightly tilted to the downside, following an intervention in the FX markets by US and Japanese authorities. Worth noting that after soft US jobs data, Japanese Finance Minister Katayama said she agreed with US Treasury Secretary Scott Bessent that FX markets had been affected by moves rather than fundamentals.

This pushed GBP/JPY to the day's low of 211.47, slightly below the 200-day SMA of 211.91, but buyers reclaimed the latter and surpassed 212.00. After the rebound, the cross is about to end Friday’s session near the highs, but it will face key resistance at the 100-day SMA at 214.48, followed by the 50-day SMA at 215.42.

In the event of further losses, the first GBP/JPY support is 212.00. Below the next support is the 200-day SMA at 211.91, followed by 211.00. Beneath emerges the August 3 low of 209.58.

GBP/JPY Price Chart – Daily
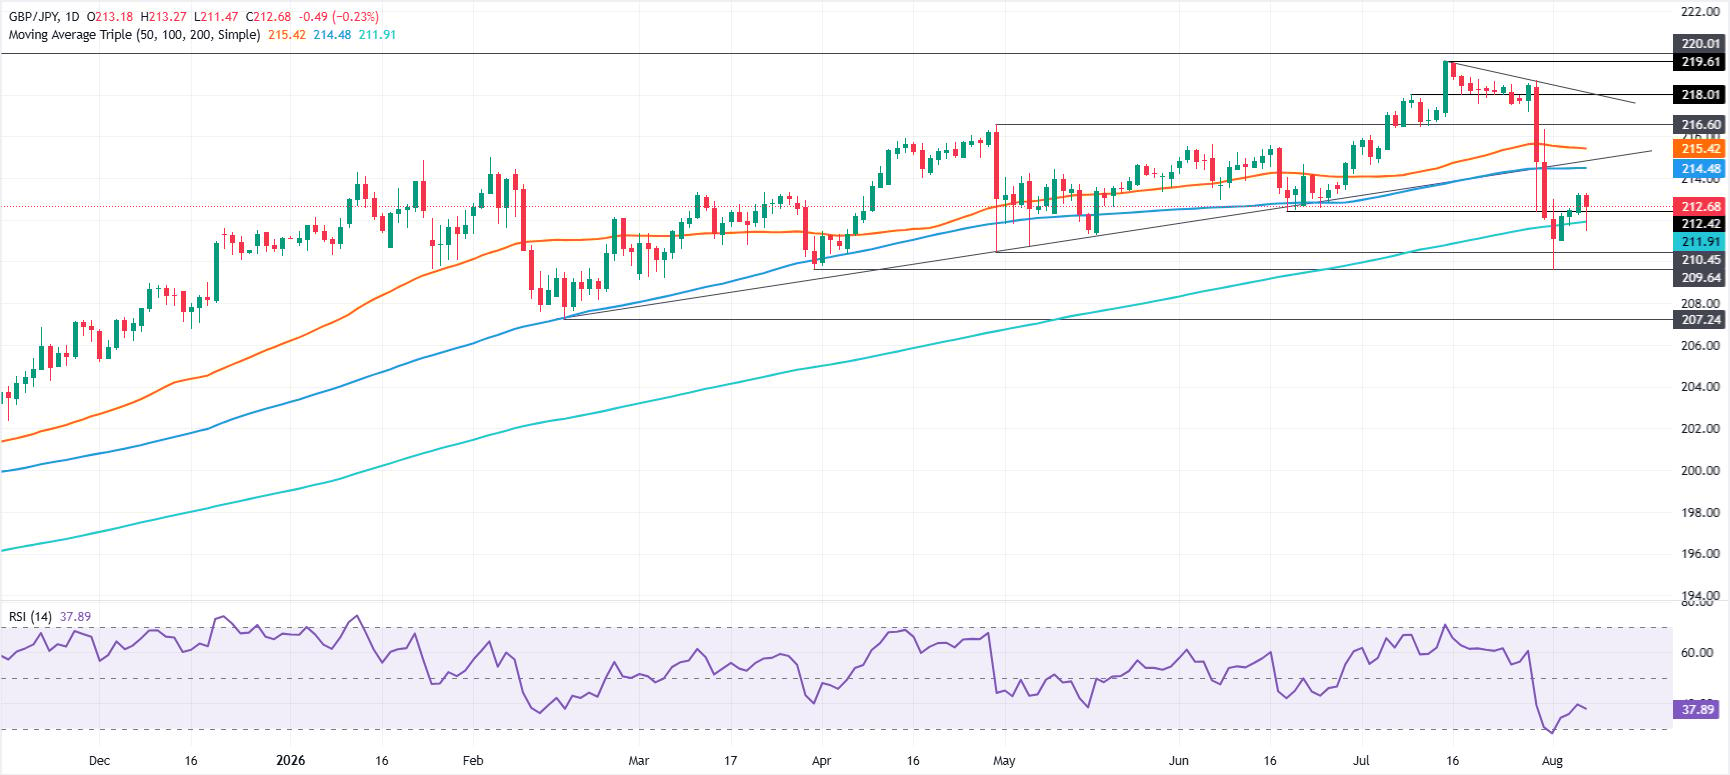
GBP/JPY daily chart

Japanese Yen Price This week

The table below shows the percentage change of Japanese Yen (JPY) against listed major currencies this week. Japanese Yen was the strongest against the British Pound.

USD EUR GBP JPY CAD AUD NZD CHF
USD -0.11% -0.02% 0.25% -0.50% -0.42% 0.10% 0.13%
EUR 0.11% 0.08% 0.38% -0.38% -0.18% 0.20% 0.25%
GBP 0.02% -0.08% -0.09% -0.48% -0.31% 0.11% 0.14%
JPY -0.25% -0.38% 0.09% -0.68% -0.52% -0.06% -0.04%
CAD 0.50% 0.38% 0.48% 0.68% 0.17% 0.64% 0.62%
AUD 0.42% 0.18% 0.31% 0.52% -0.17% 0.40% 0.44%
NZD -0.10% -0.20% -0.11% 0.06% -0.64% -0.40% 0.04%
CHF -0.13% -0.25% -0.14% 0.04% -0.62% -0.44% -0.04%

The heat map shows percentage changes of major currencies against each other. The base currency is picked from the left column, while the quote currency is picked from the top row. For example, if you pick the Japanese Yen from the left column and move along the horizontal line to the US Dollar, the percentage change displayed in the box will represent JPY (base)/USD (quote).

Disclaimer: For information purposes only. Past performance is not indicative of future results.
placeholder
Gold Price Forecast: Can Gold Still Rise Above $4,300 Ahead of July Non-Farm Payrolls?As of the European session on August 7, gold prices ( XAUUSD) extended their recent strong performance, rising over 1% intraday to briefly cross the $4,300 mark. With a cumulative gain of
Author  TradingKey
11 hours ago
As of the European session on August 7, gold prices ( XAUUSD) extended their recent strong performance, rising over 1% intraday to briefly cross the $4,300 mark. With a cumulative gain of
placeholder
NFP or Iran: Which factor will break the US Dollar Index out of its consolidation?The US Dollar Index (DXY) trades around 99.95 at the time of writing on Friday, virtually unchanged on the day, as investors refrain from placing aggressive bets ahead of the release of the July US employment report.
Author  FXStreet
11 hours ago
The US Dollar Index (DXY) trades around 99.95 at the time of writing on Friday, virtually unchanged on the day, as investors refrain from placing aggressive bets ahead of the release of the July US employment report.
placeholder
WTI holds firm near $77.50 as escalating Middle East tensions threaten oil supply routesWest Texas Intermediate (WTI) oil price remains steady after registering modest gains in the previous day, trading around $77.50 per barrel during the Asian hours on Friday.
Author  FXStreet
19 hours ago
West Texas Intermediate (WTI) oil price remains steady after registering modest gains in the previous day, trading around $77.50 per barrel during the Asian hours on Friday.
placeholder
Bitcoin Price Forecast: Persistent ETF inflows, easing Middle East tensions lift risk appetiteBitcoin (BTC) extends its gains, trading above $64,800 at the time of writing on Thursday, breaking above the key resistance zone. Institutional demand supports BTC price action with spot Exchange Traded Funds (ETFs) recording a third consecutive day of inflows so far this week.
Author  FXStreet
Yesterday 10: 09
Bitcoin (BTC) extends its gains, trading above $64,800 at the time of writing on Thursday, breaking above the key resistance zone. Institutional demand supports BTC price action with spot Exchange Traded Funds (ETFs) recording a third consecutive day of inflows so far this week.
placeholder
Australian Dollar remains calm following Trade Balance dataAUD/USD steadies after two days of gains, trading around 0.7060 during the Asian hours on Thursday. The pair moves little as the Australian Dollar (AUD) remains silent following the release of domestic Trade Balance data.
Author  FXStreet
Yesterday 02: 09
AUD/USD steadies after two days of gains, trading around 0.7060 during the Asian hours on Thursday. The pair moves little as the Australian Dollar (AUD) remains silent following the release of domestic Trade Balance data.
Related Instrument
goTop
quote