Bitcoin ETF Inflows For 2025 Now Outpace 2024, Data Shows

Mitrade
coverImg
Source: DepositPhotos

US Bitcoin spot exchange-traded funds (ETFs) have seen more inflows this year so far compared to the same point in 2024, according to data.

Bitcoin Spot ETF Net Inflows Have Crossed $14.8 Billion In 2025 So Far

In a new post on X, the Head of Research at CryptoQuant, Julio Moreno, has discussed about how the US spot ETF inflows compare between 2024 and 2025 for Bitcoin.

Spot ETFs refer to investment vehicles that provide for an alternative route of exposure to BTC’s price movements. These ETFs trade on traditional platforms and the investor doesn’t have to deal with custody themselves, as the ETF provider holds the coin on their behalf.

This means that traders who don’t want to bother with digital asset wallets and exchanges can use these vehicles to invest into Bitcoin in a mode that’s familiar to them.

In the US, the Securities and Exchange Commission (SEC) approved BTC spot ETFs on January 10th, 2024. The ETFs were quick to gain popularity and today represent an important cornerstone of the market.

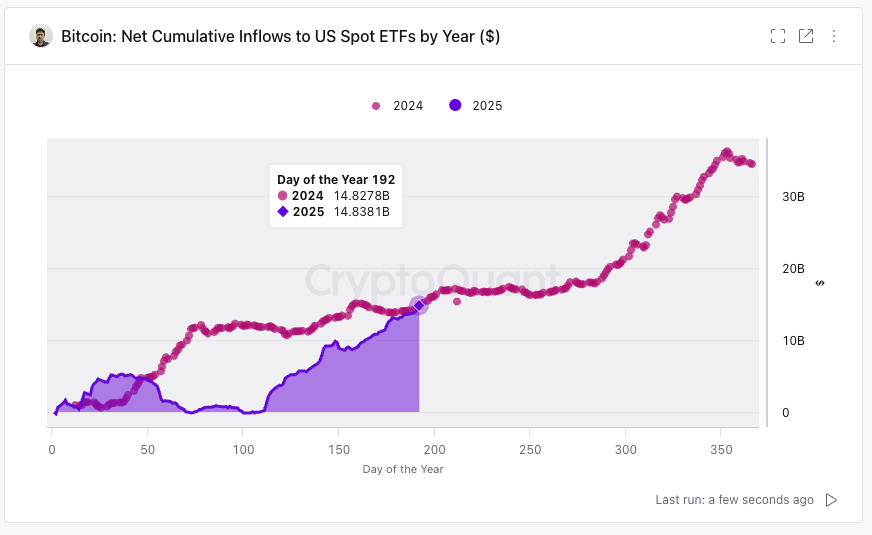
While 2024 was more of an up-only year for them, 2025 has so far been different. Below is the chart shared by Moreno that shows how the cumulative net inflow trend for the Bitcoin spot ETFs has compared this year versus the last.
Bitcoin Spot ETFs

As is visible in the graph, the US Bitcoin spot ETF inflows were initially ahead of pace in 2025 relative to 2024, but as the market downturn took hold, inflows dried up and 2025 fell significantly behind.

A few months into the year, though, demand for spot ETFs started to return and the gap began to shrink. Now, following the latest wave of inflows that has accompanied the rally to the new price all-time highs (ATHs), 2025 inflows have flipped 2024.

From the chart, it’s apparent that 2025 cumulative net inflows stand at $14.8381 billion right now. At the same phase of the year in 2024, they amounted to $14.8278 billion.

The spot ETF demand had been sideways at this point of the time last year, so it’s possible that if inflows continue at the current pace, 2025 will gain some distance.

That said, it only remains to be seen how long demand can keep up, as in 2024, inflows saw an acceleration toward the end of the year as interest flooded into the market alongside the surge beyond $100,000.

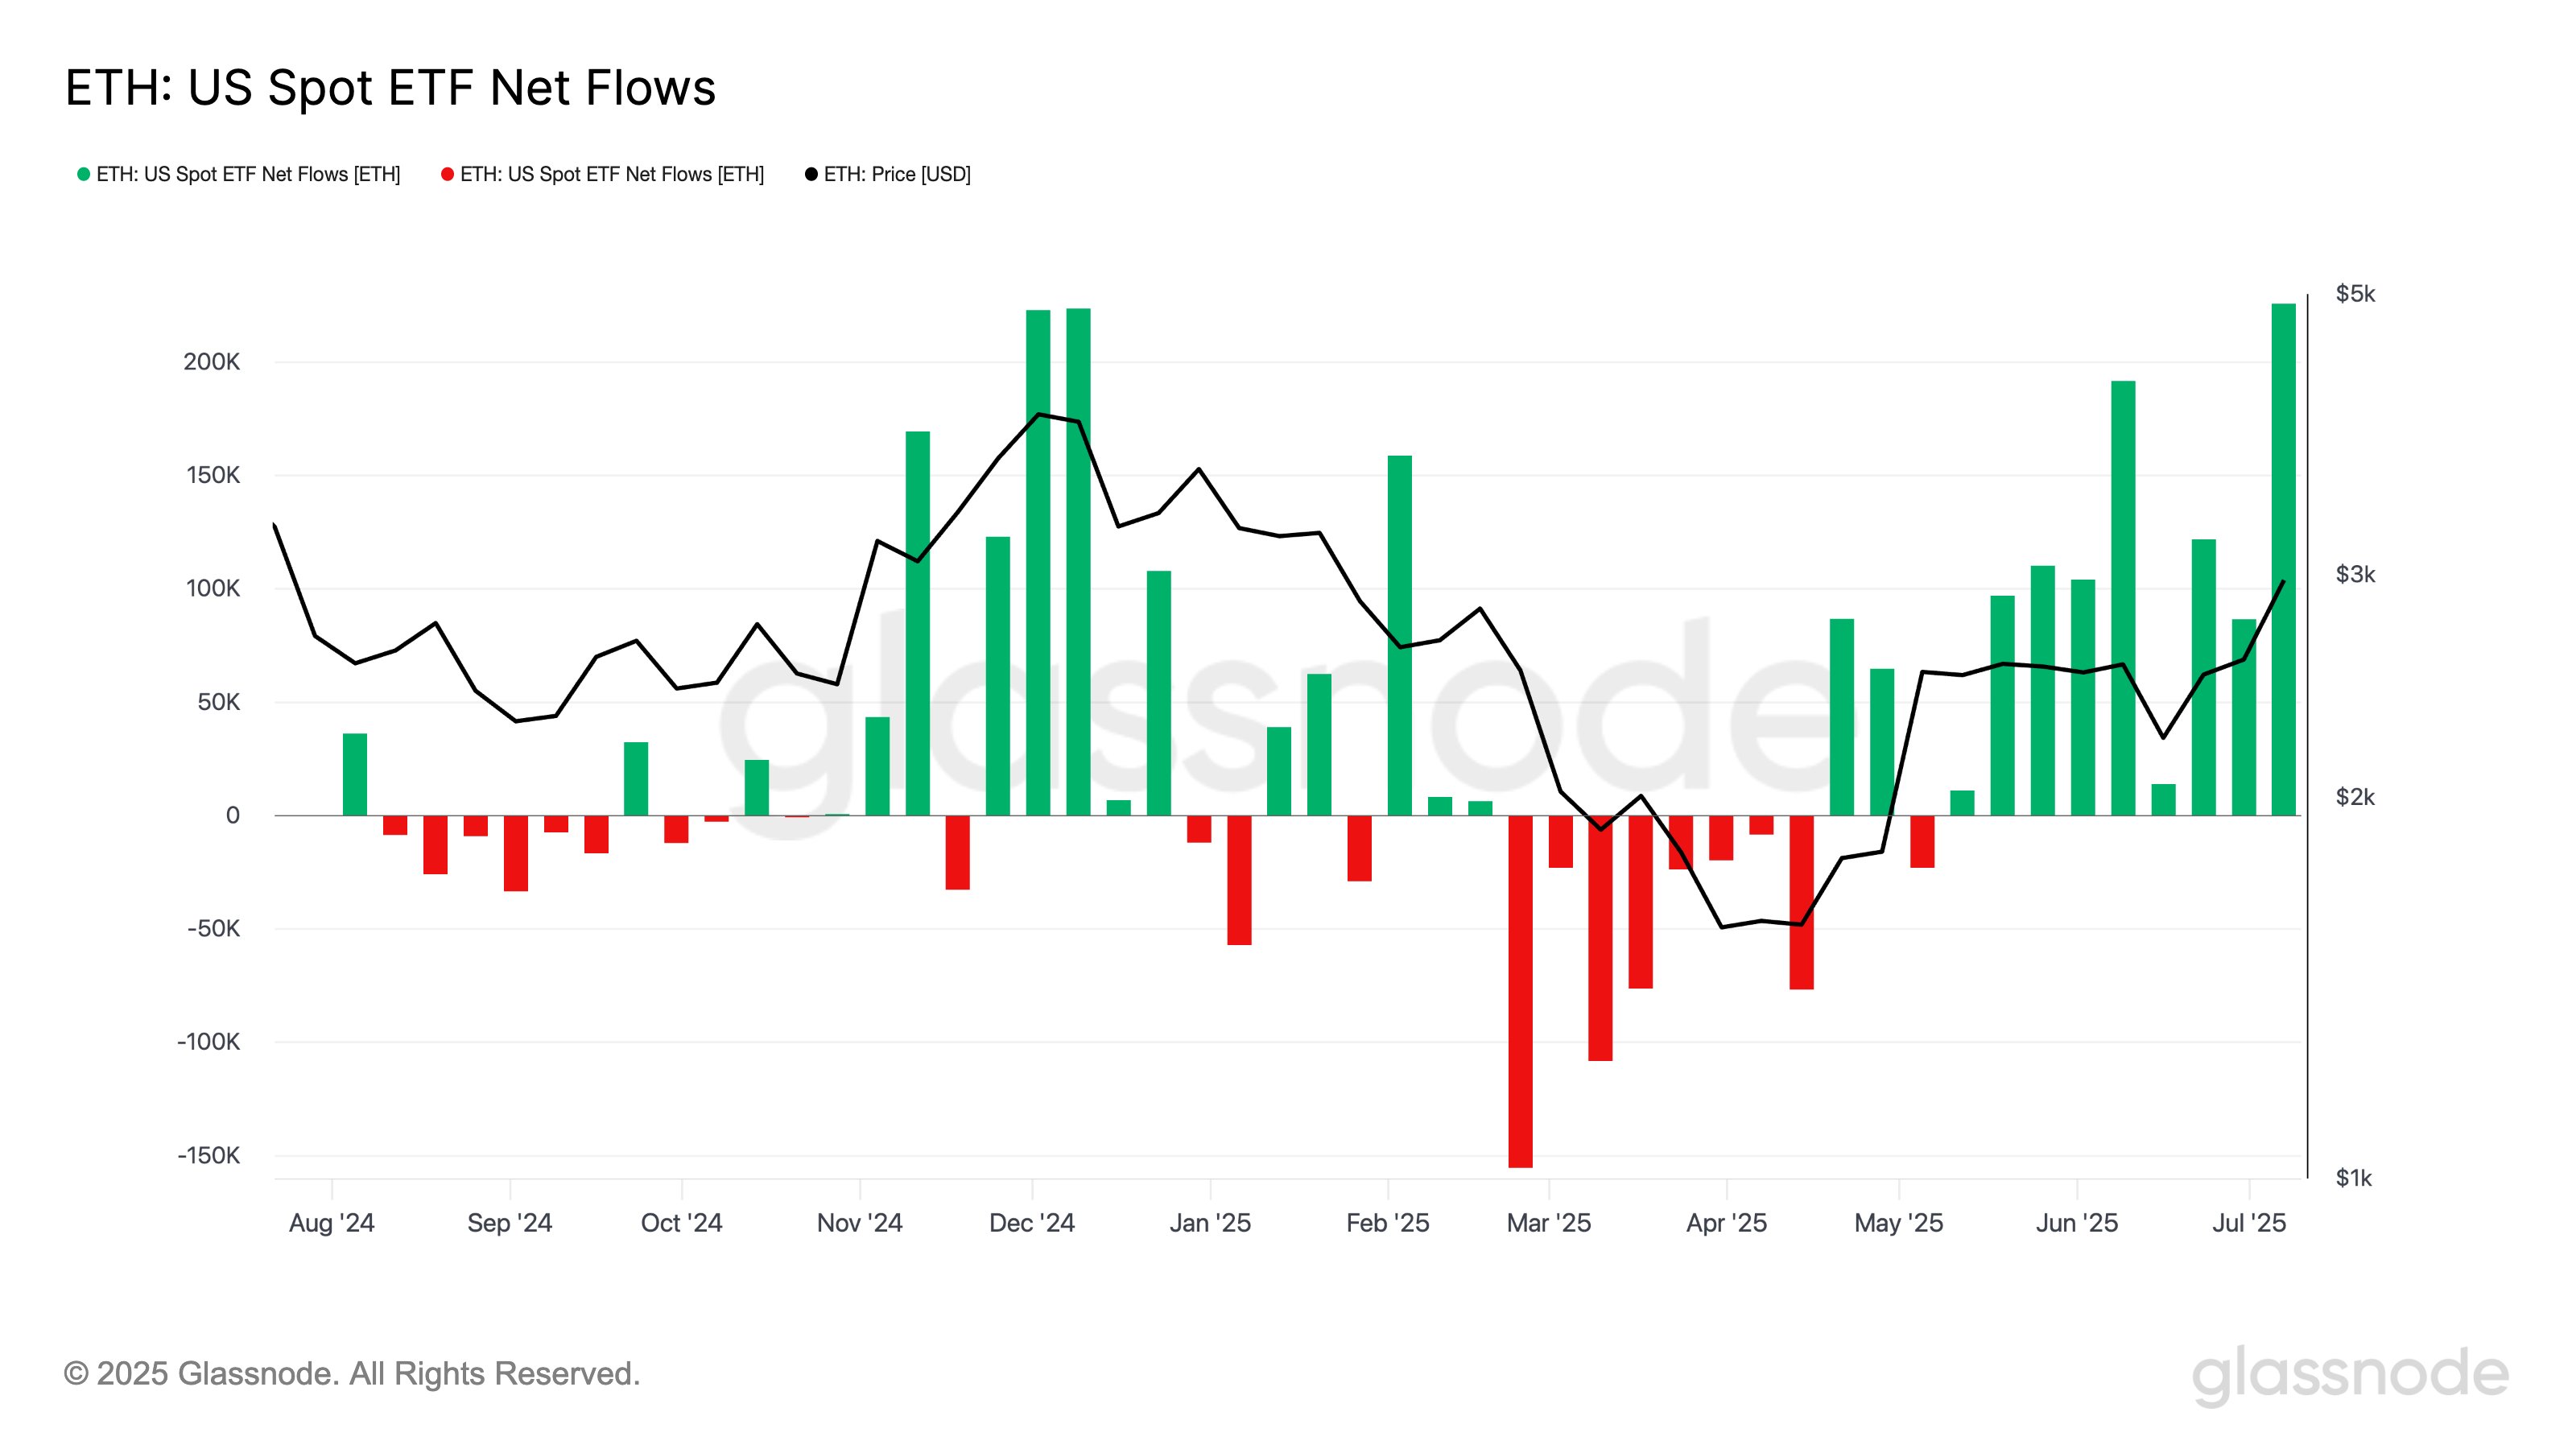
In some other news, US Ethereum spot ETFs have been seeing a boom of their own recently, as the netflow has remained green for many weeks now.
Ethereum US Spot ETFs

Last week was the largest for the Ethereum spot ETFs since the SEC approval in mid-2024, with inflows totaling at 225,857 ETH.

BTC Price

Bitcoin set a new ATH beyond $123,000 yesterday, but the asset has since registered a drop as its price has returned to $117,300.

Bitcoin Price Chart

Read more

  • Gold Price Forecast: Gold Tumbles Below $3,900 as Trump Says No Need for Iran Deal; Can October PPI Spur a Rebound?
  • * The content presented above, whether from a third party or not, is considered as general advice only.  This article should not be construed as containing investment advice, investment recommendations, an offer of or solicitation for any transactions in financial instruments.

    goTop
    quote
    Related Articles
    placeholder
    Ethereum Drops Below $2,000 After Plunging Over 20% in a Month as Odds of $1,500 Retest SurgeEthereum Plunges Over 20% in a Month, Risking a Retest of $1,500 After Losing the $2,000 Defense Line.On November 13, Ethereum (ETH) plunged more than 5%, officially falling below the key
    Author  TradingKey
    Nov 13, Fri
    Ethereum Plunges Over 20% in a Month, Risking a Retest of $1,500 After Losing the $2,000 Defense Line.On November 13, Ethereum (ETH) plunged more than 5%, officially falling below the key
    placeholder
    Bitcoin lost its 200-day average — but the exit started three sessions before the CPIBitcoin fell 2.5% to about $73,400 on 11 November, an 11-week low, breaking its 200-day moving average near $73,100. The 24-hour liquidation tally reached $632 to $705 million, roughly 82% of it longs. But spot ETF outflows began three sessions earlier and USDT's market cap has shrunk $6.6 billion in 60 days — the leveraged length left before the inflation print did. A double top at 81,890 and 81,080 leaves a measured target of 69,366.
    Author  Suzie
    Nov 11, Wed
    Bitcoin fell 2.5% to about $73,400 on 11 November, an 11-week low, breaking its 200-day moving average near $73,100. The 24-hour liquidation tally reached $632 to $705 million, roughly 82% of it longs. But spot ETF outflows began three sessions earlier and USDT's market cap has shrunk $6.6 billion in 60 days — the leveraged length left before the inflation print did. A double top at 81,890 and 81,080 leaves a measured target of 69,366.
    placeholder
    Bitcoin Price Forecast: BTC faces pressure as weekly ETF outflows hit $1.28 billionBitcoin (BTC) remains under pressure on Monday, trading below the 50-week Simple Moving Average (SMA) at $75,222 after extending its losing streak to five consecutive weeks.
    Author  FXStreet
    Nov 09, Mon
    Bitcoin (BTC) remains under pressure on Monday, trading below the 50-week Simple Moving Average (SMA) at $75,222 after extending its losing streak to five consecutive weeks.
    placeholder
    Bitcoin ETFs sold $1.28 billion in a week — and BTC is still above 75,000US spot Bitcoin ETFs logged $1.28 billion of net outflows in the week to Nov 6, the largest since late June, with BlackRock's IBIT accounting for $1.21 billion. Yet BTC only fell from $80,405 to $74,940, a 6.8% move. The gap between the fund flow and the price is the story: leveraged longs were flushed, but spot holders did not follow the ETFs out — and $75,000 is the line that decides whether that reading holds.
    Author  Suzie
    Nov 09, Mon
    US spot Bitcoin ETFs logged $1.28 billion of net outflows in the week to Nov 6, the largest since late June, with BlackRock's IBIT accounting for $1.21 billion. Yet BTC only fell from $80,405 to $74,940, a 6.8% move. The gap between the fund flow and the price is the story: leveraged longs were flushed, but spot holders did not follow the ETFs out — and $75,000 is the line that decides whether that reading holds.
    placeholder
    Binance replaced 95% of a $6.3bn hole — Bitcoin is trading the plumbing, not the coinBinance resumed withdrawals on November 1 after a record $6.3bn theft. In the first 9.5 hours, users withdrew $4.64bn and deposited $1.01bn, a net outflow of $3.64bn, or 2.1% of assets. Bitcoin fell to 76,173 and is now 78,473. The market is pricing the exchange, not the supply.
    Author  Suzie
    Nov 02, Mon
    Binance resumed withdrawals on November 1 after a record $6.3bn theft. In the first 9.5 hours, users withdrew $4.64bn and deposited $1.01bn, a net outflow of $3.64bn, or 2.1% of assets. Bitcoin fell to 76,173 and is now 78,473. The market is pricing the exchange, not the supply.
    Live Quotes
    Name / SymbolChart% Change / Price
    BTCUSD
    BTCUSD
    0.00%0.00

    cryptocurrency Related Articles

    • Top 3 Price Prediction: Bitcoin, Ethereum, Ripple — Bulls take the reins, with $100K BTC, $3,500 ETH and $2.35 XRP in focus
    • Best Strategies When BTC Price Drops: From Hedging to Accumulating
    • How to Day Trade Crypto? Simplest Day Trading Strategy Ever
    • Trading Chart Patterns:Ultimate Guide to Price Action
    • Places that Provide Cheapest Ways to Buy Bitcoin In 2025
    • 10 Best Crypto With Most Potential to Buy and invest in 2025 - Top Picks from Expert Traders

    Click to view more