


Dow Jones Industrial Average dodges a hike December still prices
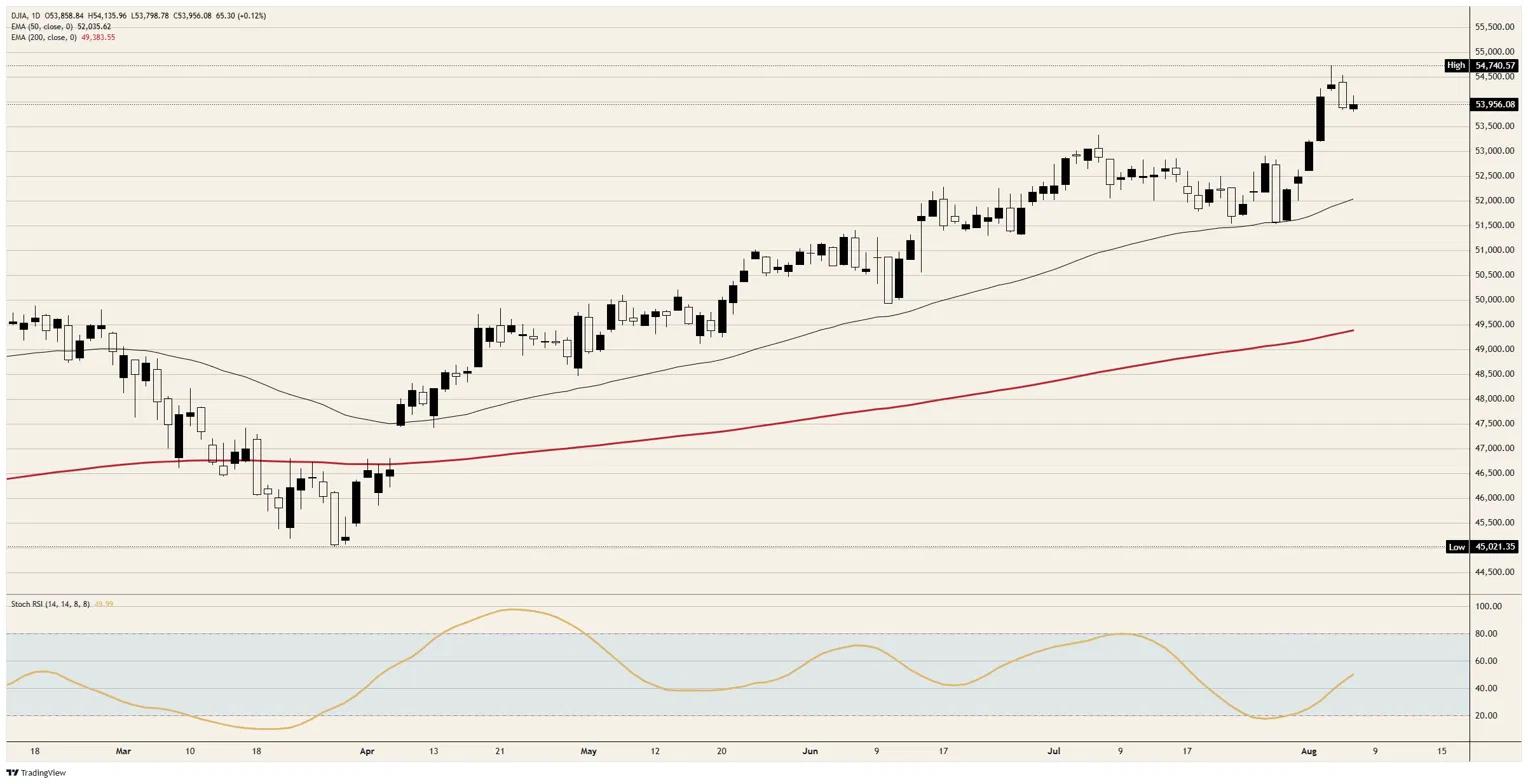
- DJIA trades near 54,000, roughly 800 points beneath this week's record.
- July payrolls fell 23K against an 80K consensus, a 103K miss.
- December carries zero probability of the current range surviving.
The American labour market contracted in July and the Dow Jones Industrial Average answered with a gain of roughly 65 points, a tenth of a percent, trading near 54,000 into the afternoon. The session high just above 54,100 printed in the minutes after the 12:30 GMT release and has not been beaten since. That is the entire equity response to a payrolls contraction.
A postponement dressed as a pivot
Rate futures did move on the number, and they moved in one direction only, which is outward. The 16 September meeting now carries a 44.1% chance of a quarter-point increase against 55.9% for a hold, down from 59.2% a week ago. The 28 October figure fell to 68.5% from 88.0% over the same stretch.
What did not move is the destination. On 9 December the current 3.50% to 3.75% range carries zero probability, meaning a quarter point is still fully priced by year end, exactly as it was before the labour market fell apart. The only genuine casualty was the second hike, whose December tail halved to 14.4% from 31.3%. A calendar shifted, a policy path did not.
The long end declined to celebrate
The bond market split the report cleanly by maturity. Two-year notes, which trade the next two meetings and nothing further, rallied more than four basis points to 4.204% and the lowest yield since 17 July. The thirty-year moved less than a single basis point, to 5.208%.
That is the same thirty-year yield that stood at its highest since 2007 a week ago, and an outright contraction in American payrolls was worth almost nothing to it. Ten-year notes gave up barely a basis point at 4.651%. The curve steepened because the front end believes the Fed is waiting while the long end does not believe that waiting changes the price of money over thirty years.
Three of the four improvements were subtractions
The unemployment rate fell to 4.1% from 4.2% against a consensus that had it holding, and it fell because the labour force participation rate slipped to 61.4%, the lowest in more than five years. The broader U6 underemployment rate did not improve at all, holding at 7.9%. A jobless rate that drops because people stop looking is not a labour market repairing itself.
Wage growth cooled to 3.2% YoY against 3.5% expected, with the prior reading revised down to 3.4% and June payrolls cut to 20K from the 57K first reported. Layoff announcements sit near a two-year low, which is the tell worth keeping: this is a hiring freeze rather than a firing wave. Frozen markets take considerably longer to thaw than they do to break.
The record came before the reason
The index printed a record just short of 54,750 earlier this week and is on track for a second consecutive weekly gain, close to 1,500 points and roughly 3%. Almost none of that advance was a labour-market trade, because the labour-market data did not exist until Friday morning. It was a bet on the Strait of Hormuz reopening.
The reopening trade that built those records remains a forecast rather than a fact. Tehran and Muscat are close to a transit framework that Iranian officials concede would not by itself reopen the waterway, Tehran denies negotiating directly with Washington, and eight vessels crossed the Strait on Tuesday against roughly 100 a day before the war. Crude Oil near $78.00 is pricing an outcome the shipping data has not delivered.
Two prints stand between here and September
With no meeting in August, the 16 September decision has one more payrolls report and Wednesday's Consumer Price Index (CPI) to absorb, after a 14:00 GMT speech on Friday that the calendar scored neutral. Headline inflation is forecast at 0.1% MoM against June's -0.4%, with the annual rate easing to 3.4% from 3.5%, while core is seen at 0.2% MoM and 2.5% YoY.
The Producer Price Index (PPI) follows on Thursday at 0.1% MoM against -0.3%, and Friday brings retail sales alongside a Michigan sentiment reading forecast to fall to 54 from 55.2. The inflation expectations buried in that survey, pinned at 4.2% one year out and 3.3% over five, decide whether September's coin flip becomes a hike again. Nothing in Friday's payrolls report touched them.
Levels and bias
Resistance: The session high just above 54,100 is the first line, and the afternoon rebound stopped short of it. Above that the record just short of 54,750 is the only structure left, with 54,000 behaving as a handle the index trades around rather than through.
Support: The 53,800 area holds both the overnight low and the floor of the cash-open flush, which makes it the only level this session has genuinely tested. Beneath it the tape thins toward the 53,500 area, and there is nothing structural until the 50-day Exponential Moving Average (EMA) near 52,000.
Bias: Bullish while the 53,800 area holds, with the record just short of 54,750 as the objective and a daily Stochastic Relative Strength Index (Stoch RSI) near 50 leaving room in either direction. A daily close beneath 53,800 opens the 53,500 area and turns this week's records into a failed breakout.
Dow Jones daily chart
Dow Jones FAQs
The Dow Jones Industrial Average, one of the oldest stock market indices in the world, is compiled of the 30 most traded stocks in the US. The index is price-weighted rather than weighted by capitalization. It is calculated by summing the prices of the constituent stocks and dividing them by a factor, currently 0.152. The index was founded by Charles Dow, who also founded the Wall Street Journal. In later years it has been criticized for not being broadly representative enough because it only tracks 30 conglomerates, unlike broader indices such as the S&P 500.
Many different factors drive the Dow Jones Industrial Average (DJIA). The aggregate performance of the component companies revealed in quarterly company earnings reports is the main one. US and global macroeconomic data also contributes as it impacts on investor sentiment. The level of interest rates, set by the Federal Reserve (Fed), also influences the DJIA as it affects the cost of credit, on which many corporations are heavily reliant. Therefore, inflation can be a major driver as well as other metrics which impact the Fed decisions.
Dow Theory is a method for identifying the primary trend of the stock market developed by Charles Dow. A key step is to compare the direction of the Dow Jones Industrial Average (DJIA) and the Dow Jones Transportation Average (DJTA) and only follow trends where both are moving in the same direction. Volume is a confirmatory criteria. The theory uses elements of peak and trough analysis. Dow’s theory posits three trend phases: accumulation, when smart money starts buying or selling; public participation, when the wider public joins in; and distribution, when the smart money exits.
There are a number of ways to trade the DJIA. One is to use ETFs which allow investors to trade the DJIA as a single security, rather than having to buy shares in all 30 constituent companies. A leading example is the SPDR Dow Jones Industrial Average ETF (DIA). DJIA futures contracts enable traders to speculate on the future value of the index and Options provide the right, but not the obligation, to buy or sell the index at a predetermined price in the future. Mutual funds enable investors to buy a share of a diversified portfolio of DJIA stocks thus providing exposure to the overall index.
Recommended Articles


