


Silver Price Forecast: XAG/USD resumes decline as traders assess Trump policy’s implications
- Silver price retreats from $32.30 as investors expect Trump’s protectionist policies could force the Fed to turn hawkish on interest rates.
- Fed Powell doesn’t see any near-term impact of Trump’s policies on the interest rate path.
- China’s economic package failed to impress market participants.
Silver price (XAG/USD) resumes its downside move after its recovery move met resistance near $32.20 in the North American session on Friday. The white metal falls back as traders assess the implications of Donald Trump’s victory in the United States (US) presidential elections on domestic and the global economy.
Donald Trump promised to raise tariffs by 10% universally, expecting China that could face duties rising as much as 60%. Higher tariffs on offering coming from the external economy would boost in house production and prompt labor demand, which will prompt inflationary pressures. This will force the Federal Reserve (Fed) to opt for a hawkish interest rate stance.
However, Fed Chair Jerome Powell doesn’t see any immediate impact of Trump’s victory on the monetary policy action in the upcoming meetings after the bank cut interest rates by 25 basis points (bps) to 4.50%-4.75% on Thursday.
Meanwhile, some recovery in the US Dollar after Thursday’s correction has also weighed on the Silver price. The US Dollar Index (DXY), which gauges Greenback’s value against six major currencies, jumps to nearly 106.40.
Apart from expectations for the Fed turning hawkish, an absence of meaningful economic stimulus by China has also weighed on the Silver price. In Friday’s late Asian session, China announced a massive 10 trillion yuan program to refinance local government debt with approval by the National People’s Congress. Market experts see the stimulus package as a measure against Trump’s potential tariffs, however, they consider it as insufficient to fix the likely impact on their economic growth.
Economists at Standard Chartered Plc expect “China’s growth would suffer a hit of as much as two percentage points should Trump follow through on his campaign vow to raise tariffs on Chinese goods to 60%.”
Silver as a metal has applications in various industries such as solar energy, mining, and power and signs of weak China growth prospects impact the Silver price.
Silver technical analysis
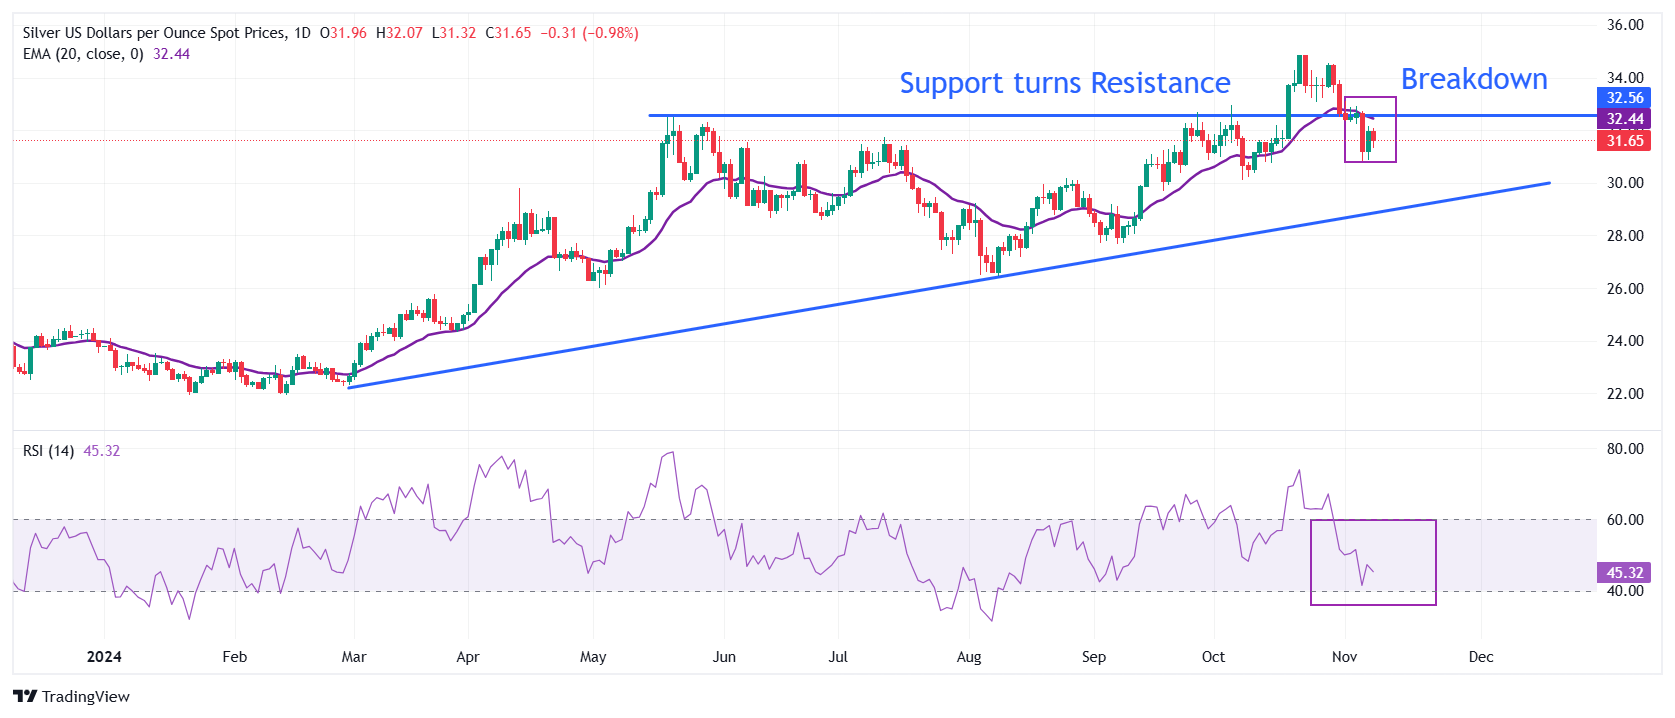
Silver price slides to near $31.00 after breaking below the horizontal support plotted from the May 21 high of $32.50. The near-term trend of the Silver price has turned bearish as it has dropped below the 50-day Exponential Moving Average (EMA), which trades around $31.60.
The asset could find support near the upward-sloping trendline around $29.00, plotted from the February 28 low of $22.30.
The 14-day Relative Strength Index (RSI) dives to near 40.00. Should RSI (14) falls below 40.00, a bearish momentum will be triggered.
Silver daily chart
Silver FAQs
Silver is a precious metal highly traded among investors. It has been historically used as a store of value and a medium of exchange. Although less popular than Gold, traders may turn to Silver to diversify their investment portfolio, for its intrinsic value or as a potential hedge during high-inflation periods. Investors can buy physical Silver, in coins or in bars, or trade it through vehicles such as Exchange Traded Funds, which track its price on international markets.
Silver prices can move due to a wide range of factors. Geopolitical instability or fears of a deep recession can make Silver price escalate due to its safe-haven status, although to a lesser extent than Gold's. As a yieldless asset, Silver tends to rise with lower interest rates. Its moves also depend on how the US Dollar (USD) behaves as the asset is priced in dollars (XAG/USD). A strong Dollar tends to keep the price of Silver at bay, whereas a weaker Dollar is likely to propel prices up. Other factors such as investment demand, mining supply – Silver is much more abundant than Gold – and recycling rates can also affect prices.
Silver is widely used in industry, particularly in sectors such as electronics or solar energy, as it has one of the highest electric conductivity of all metals – more than Copper and Gold. A surge in demand can increase prices, while a decline tends to lower them. Dynamics in the US, Chinese and Indian economies can also contribute to price swings: for the US and particularly China, their big industrial sectors use Silver in various processes; in India, consumers’ demand for the precious metal for jewellery also plays a key role in setting prices.
Silver prices tend to follow Gold's moves. When Gold prices rise, Silver typically follows suit, as their status as safe-haven assets is similar. The Gold/Silver ratio, which shows the number of ounces of Silver needed to equal the value of one ounce of Gold, may help to determine the relative valuation between both metals. Some investors may consider a high ratio as an indicator that Silver is undervalued, or Gold is overvalued. On the contrary, a low ratio might suggest that Gold is undervalued relative to Silver.
Recommended Articles


