


Gold price remains at bay with US data in focus
- Gold price trades with caution in the countdown to a string of US economic data.
- Firm Fed rate cut hopes to keep the upside in the US Dollar limited.
- Gold price in India sinks due to customs duty reduction.
Gold price (XAU/USD) remains on the defensive slightly below the round-level resistance of $2,400 in Tuesday’s European session. The precious metal remains under pressure amid firm speculation that Donald Trump could emerge victorious in the United States (US) presidential elections in November.
The expectations for Donald Trump gaining a second term rose after an assassination attack on him and US President Joe Biden’s withdrawal of his re-election bid from the White House. However, US Vice President Kamala Harris has been chosen as the nominee of Democrats.
Growing speculation for Trump 2.0 has prompted upside risks to consumer inflation expectations. In a note on Monday, Australian investment bank Macquarie said, "Trump 2.0 will be a more inflationary policy regime, given restricted immigration, higher tariffs, and the extension of the Tax Cut and Jobs Act of 2025." The scenario is favorable for the US Dollar (USD). The US Dollar Index (DXY), which tracks the Greenback’s value against six major currencies, edges higher to near 104.40. An appreciation of the US Dollar makes investment in Gold more expensive for investors.
Daily digest market movers: Gold price will be influenced by US data this week
- Gold price struggles to regain ground above the crucial resistance of $2,400. The near-term outlook of the Gold price has become uncertain as investors await a slew of US economic data, which will be published this week.
- Investors will focus on the preliminary US S&P Global PMI for July, Q2 Gross Domestic Product (GDP), and Durable Goods Orders and Personal Consumption Expenditures Price Index (PCE) data for June, which will provide fresh cues about when the US Federal Reserve (Fed) will start reducing interest rates.
- The Manufacturing PMI is estimated to have expanded at a meager pace to 51.7 from June’s reading of 51.6. The Services PMI, a measure of activities in the service sector, is estimated to have expanded at a slower pace of 54.4 from the prior release of 55.3.
- The major trigger will be the Fed’s preferred inflation gauge, the PCE index, which will indicate whether price pressures remain on track to return to the desired rate of 2%. The confidence of Fed officials that inflation has returned to the path of 2% grew after recent inflation readings showed that price pressures rose at a slower-than-expected pace in June.
- According to the CME FedWatch tool, 30-day Federal Fund futures show the central bank beginning to lower its key borrowing rates from their current levels in the September meeting. The Fed is also expected to cut interest rates again in November or December.
- In the Indian region, Multi Commodity Exchange (MCX) Gold price nosedives below Rs. 69,000 after Prime Minister Narendra Modi-led-NDA reduces basic custom duty on precious metals to 6% from 10% in the Fiscal Budget 2024-2025. The decision is expected to boost demand for physical gold.
Technical Analysis: Gold price hovers below $2,400
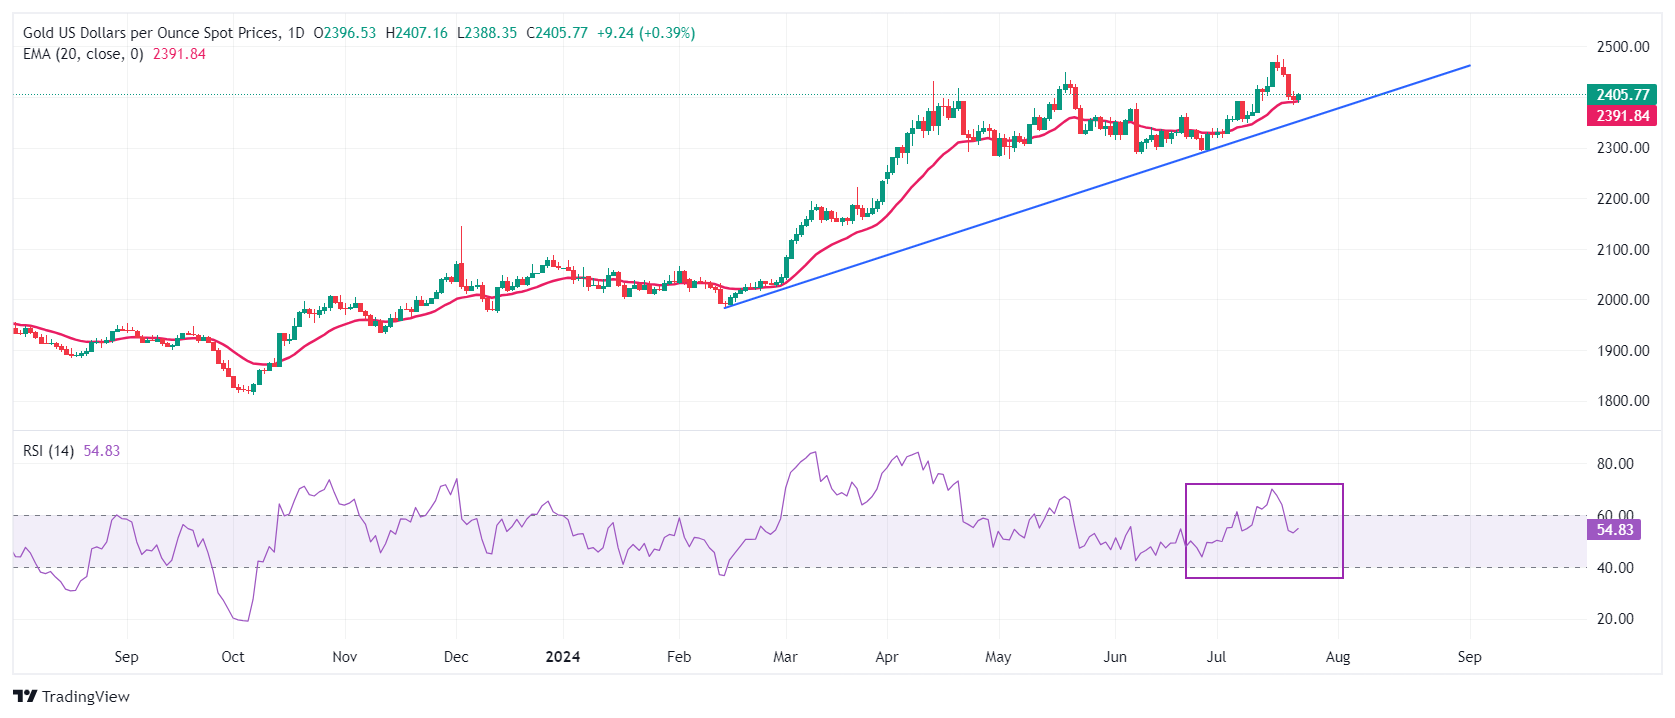
Gold price appears to be vulnerable slightly below $2,400. The precious metal declines to near the 20-day Exponential Moving Average (EMA), which trades around $2,390, suggesting that the near-term outlook has not weakened yet technically.
The advancing trendline plotted from the February 14 low at $1,984.30 will be a major support for Gold bulls.
The 14-day Relative Strength Index (RSI) drops inside the 40.00-60.00 range, suggesting that the upside momentum has stalled. However, the upside bias remains intact.
A fresh upside would appear if the Gold price breaks above all-time highs above $2,480.
Gold FAQs
Gold has played a key role in human’s history as it has been widely used as a store of value and medium of exchange. Currently, apart from its shine and usage for jewelry, the precious metal is widely seen as a safe-haven asset, meaning that it is considered a good investment during turbulent times. Gold is also widely seen as a hedge against inflation and against depreciating currencies as it doesn’t rely on any specific issuer or government.
Central banks are the biggest Gold holders. In their aim to support their currencies in turbulent times, central banks tend to diversify their reserves and buy Gold to improve the perceived strength of the economy and the currency. High Gold reserves can be a source of trust for a country’s solvency. Central banks added 1,136 tonnes of Gold worth around $70 billion to their reserves in 2022, according to data from the World Gold Council. This is the highest yearly purchase since records began. Central banks from emerging economies such as China, India and Turkey are quickly increasing their Gold reserves.
Gold has an inverse correlation with the US Dollar and US Treasuries, which are both major reserve and safe-haven assets. When the Dollar depreciates, Gold tends to rise, enabling investors and central banks to diversify their assets in turbulent times. Gold is also inversely correlated with risk assets. A rally in the stock market tends to weaken Gold price, while sell-offs in riskier markets tend to favor the precious metal.
The price can move due to a wide range of factors. Geopolitical instability or fears of a deep recession can quickly make Gold price escalate due to its safe-haven status. As a yield-less asset, Gold tends to rise with lower interest rates, while higher cost of money usually weighs down on the yellow metal. Still, most moves depend on how the US Dollar (USD) behaves as the asset is priced in dollars (XAU/USD). A strong Dollar tends to keep the price of Gold controlled, whereas a weaker Dollar is likely to push Gold prices up.
Recommended Articles


