


Mexican Peso slips as investors await Banxico’s quarterly report
- Mexican Peso declines slightly against the Dollar, traders focus on upcoming Banxico monetary policy insights.
- Market anticipates 75 basis points of rate cuts from Banxico in the first half of 2024, eyeing a shift to 10.50%.
- US economic data and Federal Reserve officials' speeches set the backdrop for MXN's movements against the USD.
Mexican Peso edges lower against the US Dollar on Wednesday, posting modest losses ahead of the Bank of Mexico (Banxico) Q4 2023 report, which would update the view of monetary policy and projections. Data from the United States showed the economy expanded at a slower pace. The USD/MXN exchanges hands at 17.09, up 0.21%.
Mexico’s economic docket is light, except for Banxico’s release. Expectations that the Mexican central bank would ease monetary policy in March remain high with market participants estimating 75 basis points of easing over the next six months. This means the Mexican interest rates, currently standing at 11.25%, would be lowered to 10.50% in the first half of 2024.
Across the border, the US schedule featured the release of Gross Domestic Product (GDP) data for Q4 2023 and Retail and Wholesale Inventories for January. Meanwhile, Federal Reserve (Fed) policymakers will cross the wires, led by regional Fed Presidents Raphael Bostic, Susan Collins and John C. Williams.
Daily digest market movers: Mexican Peso drifts lower ahead of Banxico’s Q4 2023 report
- Mexico’s economy is expected to slow down due to higher interest rates set by Banxico at 11.25%. That’s the main reason that sparked a shift in three of the five governors of the Mexican Central Bank, who are eyeing the first rate cut at the March 21 meeting.
- In that event, the Mexican Peso could depreciate, opening the door for further upside on the USD/MXN pair.
- The latest inflation report in Mexico showed that headline and underlying inflation continued to dip toward Banxico’s goal of 3%, plus or minus 1%, while economic growth exceeded estimates but finished below Q3’s 3.3%.
- Mexico’s economic data released during the week from February 26 to March 1.
- The Balance of Trade for January revealed the country posted a trade deficit of $302 million.
- Mexico’s Consumer Price Index (CPI) in the first half of February was 4.45%, down from 4.9% YoY.
- Mexico’s Core CPI slowed from 4.78% to 4.63% on an annual basis.
- Mexico’s GDP for Q4 2023 exceeded estimates of 2.4% YoY and hit 2.5%, less than Q3 2023 print of 3.3%.
- Economic trade issues between Mexico and the US could depreciate the Mexican currency if the Mexican government fails to resolve its steel and aluminum dispute with the United States. US Trade Representative Katherine Tai warned the US could reimpose tariffs on the commodities.
- Across the border, Gross Domestic Product (GDP) for the last quarter of 2023 missed estimates by a tick, though it came at 3.2% YoY, down from Q3 4.9%.
- US Retail Sales Inventories rose 0.3% MoM in January, below 0.4% in the previous month's data, while Wholesale Inventories declined -0.1% MoM, missing estimates of 0.1%
- In January, US Durable Goods Orders significantly declined to -6.1% MoM, exceeding the anticipated contraction of -4.5% and marking a steeper fall compared to December's -0.3% decrease.
- In December, the S&P/Case-Shiller Home Price Index indicated a monthly decline of -0.3%, a slight acceleration in the contraction pace from November's -0.2%. On an annual basis, home prices rose by 6.1%, surpassing both expectations and the growth rate from the previous month.
- Market players had trimmed the odds for the first 25 basis point (bps) rate cut in June, with odds lying at 49%, down from 53% a day ago, while 39% of investors expected the Fed to keep rates unchanged at the current level of 5.25%-5.50%.
Technical analysis: Mexican Peso trips down as USD/MXN meanders above 50-day SMA
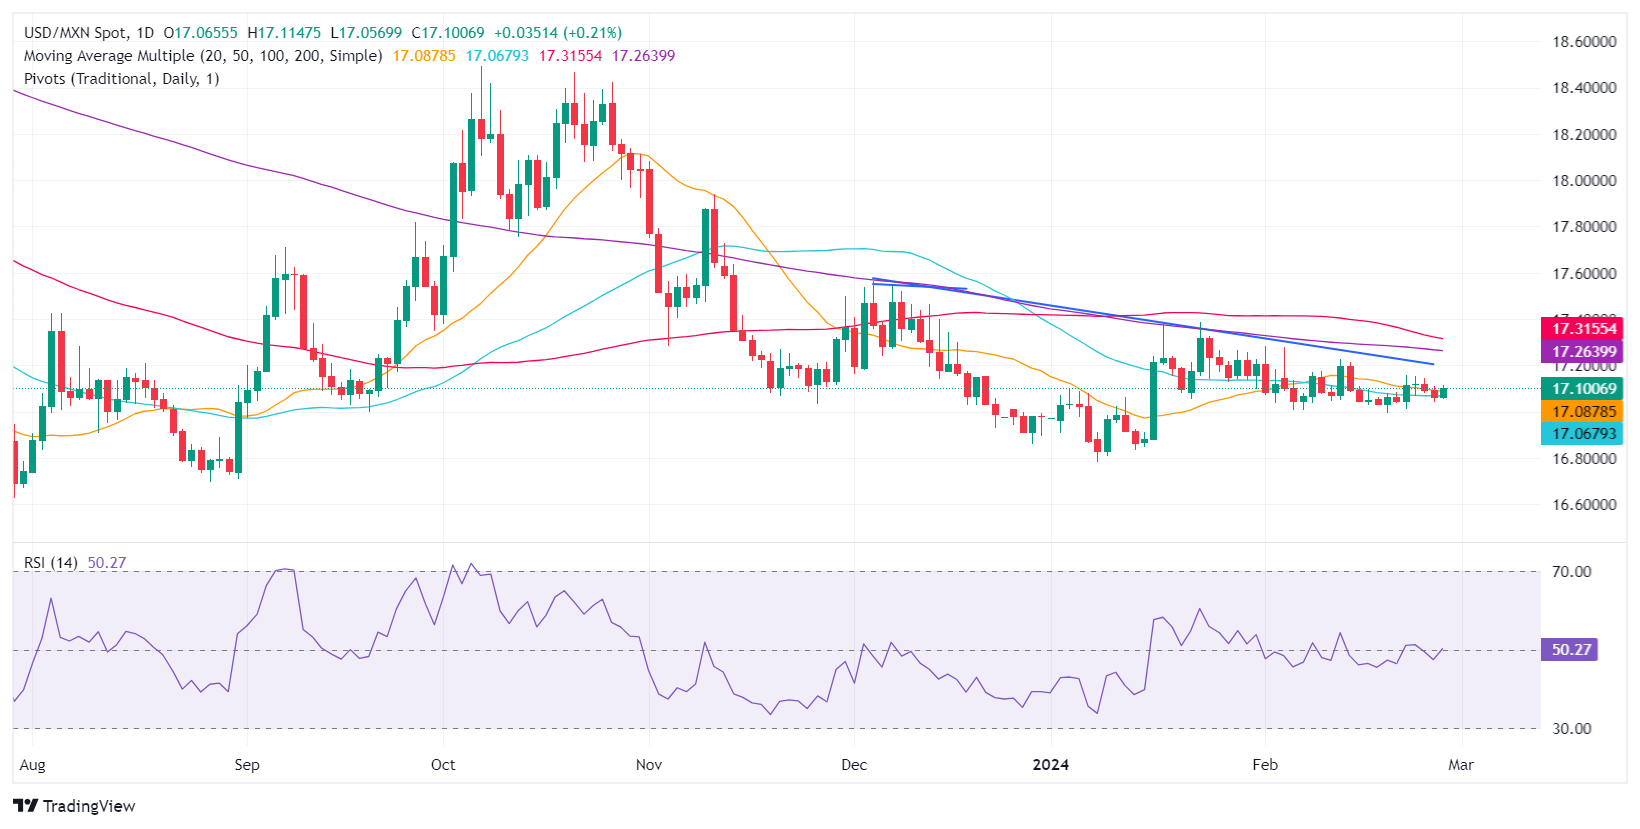
The USD/MXN is trading above the 50-day Simple Moving Average (SMA), which stands at 17.06, after the pair posted three days of losses. Relative Strength Index (RSI) studies are about to turn bullish, which could exacerbate a leg up toward the 17.10 area. Once cleared, traders could target 17.20. Further upside would be expected if buyers reclaim the 200-day SMA at 17.25 and the 100-day SMA at 17.33.
On the flip side, if USD/MXN drops below the 50-day SMA, look for a challenge of the 17.00 mark. A breach of the latter, and the pair would tumble to test yearly lows of 16.78, followed by last year’s low of 16.62.
USD/MXN Price Action – Daily Chart
Mexican Peso FAQs
What key factors drive the Mexican Peso?
The Mexican Peso (MXN) is the most traded currency among its Latin American peers. Its value is broadly determined by the performance of the Mexican economy, the country’s central bank’s policy, the amount of foreign investment in the country and even the levels of remittances sent by Mexicans who live abroad, particularly in the United States. Geopolitical trends can also move MXN: for example, the process of nearshoring – or the decision by some firms to relocate manufacturing capacity and supply chains closer to their home countries – is also seen as a catalyst for the Mexican currency as the country is considered a key manufacturing hub in the American continent. Another catalyst for MXN is Oil prices as Mexico is a key exporter of the commodity.
How do decisions of the Banxico impact the Mexican Peso?
The main objective of Mexico’s central bank, also known as Banxico, is to maintain inflation at low and stable levels (at or close to its target of 3%, the midpoint in a tolerance band of between 2% and 4%). To this end, the bank sets an appropriate level of interest rates. When inflation is too high, Banxico will attempt to tame it by raising interest rates, making it more expensive for households and businesses to borrow money, thus cooling demand and the overall economy. Higher interest rates are generally positive for the Mexican Peso (MXN) as they lead to higher yields, making the country a more attractive place for investors. On the contrary, lower interest rates tend to weaken MXN.
How does economic data influence the value of the Mexican Peso?
Macroeconomic data releases are key to assess the state of the economy and can have an impact on the Mexican Peso (MXN) valuation. A strong Mexican economy, based on high economic growth, low unemployment and high confidence is good for MXN. Not only does it attract more foreign investment but it may encourage the Bank of Mexico (Banxico) to increase interest rates, particularly if this strength comes together with elevated inflation. However, if economic data is weak, MXN is likely to depreciate.
How does broader risk sentiment impact the Mexican Peso?
As an emerging-market currency, the Mexican Peso (MXN) tends to strive during risk-on periods, or when investors perceive that broader market risks are low and thus are eager to engage with investments that carry a higher risk. Conversely, MXN tends to weaken at times of market turbulence or economic uncertainty as investors tend to sell higher-risk assets and flee to the more-stable safe havens.
Recommended Articles


