

Solana (SOLUSD) Volatility Intensified on Oct 23: What You Should Know

Source Tradingkey

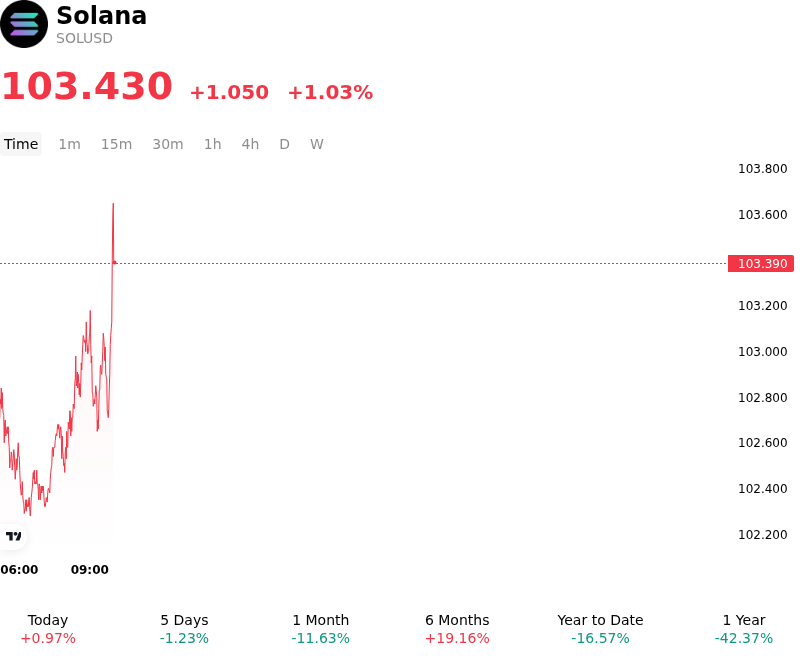
Solana (SOLUSD) is up 1.03% at Oct 23 21:50(ET), now at $103.43, with a 7-day up of 0.34%.
SummaryOverview

What is driving Solana (SOLUSD)’s stock price up today?

Solana demonstrated positive intraday price action as buyers defended key structural support levels following a temporary corrective phase, triggering a wave of short-covering and opportunistic spot accumulation. Derivatives market dynamics played a notable role in driving execution, as liquidations of leverage-heavy short positions accelerated gains above immediate overhead resistance. Improved market breadth across major digital assets further provided a favorable tailwind for higher-beta layer-one tokens, encouraging tactical capital inflows back into the asset.

A primary fundamental catalyst underpinning sentiment is the progress surrounding the network's Alpenglow upgrade. Engineered to dramatically cut transaction finality times down to sub-second benchmarks, the protocol enhancement directly addresses execution efficiency for institutional applications. This milestone reinforces Solana's competitive positioning within decentralized finance, enterprise payments, and tokenized real-world assets, where total value locked and institutional pipeline momentum remain robust.

From a macro and structural perspective, the rebound reflects resilient underlying ecosystem demand that offsets recent short-term net outflows from spot exchange-traded products. With global liquidity conditions remaining accommodating and macro risk appetite stabilizing, investors continue to prioritize layer-one networks capable of capturing real transaction volume and fee-generating activity. While traders remain watchful of overhead technical resistance and broader monetary policy shifts, current capital flows suggest market participants view recent lower range tests as attractive entry points within an ongoing long-term adoption narrative.

Technical Analysis of Solana (SOLUSD)

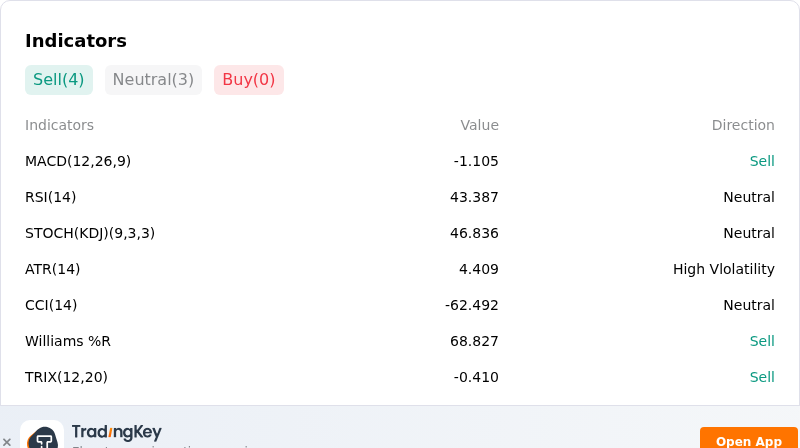
Technically, Solana (SOLUSD) shows a MACD (12,26,9) value of -1.105, indicating a sell signal. The RSI at 43.387 suggests neutral condition and the Williams %R at 68.827 suggests sell condition. Please monitor closely.
IndicatorAnalysis

More details about Solana (SOLUSD)

Recent Events and Risks:

  • Persistent Institutional Spot ETF Outflows: Spot Solana exchange-traded products have experienced an extended streak of consecutive net daily redemptions, removing structural institutional buy-side support and creating continuous overhead supply pressure on SOLUSD.
  • Head-and-Shoulders Pattern Threatening Key Support: SOL price action displays a bearish daily head-and-shoulders technical formation, where a sustained daily breakdown below the crucial $100 psychological support zone risks triggering cascading stop-loss liquidations toward lower support levels near $80 to $97.
  • Whale Inflows to Exchanges and Distribution Overhang: On-chain transaction tracking highlights significant exchange-bound whale transfers, including over 470,000 SOL (valued at over $51 million) moved to Coinbase, heightening the immediate risk of large-scale spot market sell-offs.
  • Derivatives Position Unwinding and Long Liquidations: Futures market data reveals a sharp contraction in open interest alongside multi-million-dollar forced long liquidations, exposing high-beta SOL to amplified intraday downside volatility during cross-crypto leverage flushes.
Disclaimer: For information purposes only. Past performance is not indicative of future results.
placeholder
Gold Price Analysis Today | Forex Gold Analysis | XAU/USD Analysis - October 20, 2026Get the latest gold price analysis, forex gold insights, and XAU/USD analysis for October 20, 2026. Read on for the details.
Author  Mitrade
Oct 20, Tue
Get the latest gold price analysis, forex gold insights, and XAU/USD analysis for October 20, 2026. Read on for the details.
placeholder
Dollar presses 102 as the 10-year yield sits at 5.14% — and October hike odds are only 17%The dollar index closed at 101.99 (+0.20%) on Monday after briefly topping 102.07, while the 10-year Treasury yield rose to 5.14% and the 2-year hit 4.774% — yet futures price only about a 17% chance of a hike at the October 27-28 FOMC, versus roughly 90% for December. The driver is a global bond selloff, not a Fed repricing: France's 10-year OAT jumped to 4.84% ~ 4.94% and the OAT-Bund spread widened to 140 ~ 146bp. Here are the levels, the cross-asset read-through and what to watch.
Author  Irene Q.
Oct 20, Tue
The dollar index closed at 101.99 (+0.20%) on Monday after briefly topping 102.07, while the 10-year Treasury yield rose to 5.14% and the 2-year hit 4.774% — yet futures price only about a 17% chance of a hike at the October 27-28 FOMC, versus roughly 90% for December. The driver is a global bond selloff, not a Fed repricing: France's 10-year OAT jumped to 4.84% ~ 4.94% and the OAT-Bund spread widened to 140 ~ 146bp. Here are the levels, the cross-asset read-through and what to watch.
placeholder
Gold Price Analysis Today | Forex Gold Analysis | XAU/USD Analysis - October 22, 2026Get the latest gold price analysis, forex gold insights, and XAU/USD analysis for October 22, 2026. Read on for the details.
Author  Mitrade
Yesterday 01: 58
Get the latest gold price analysis, forex gold insights, and XAU/USD analysis for October 22, 2026. Read on for the details.
placeholder
The Fed will sit still on October 28 — but 100 of 100 economists now expect a December hikeA Reuters poll run October 16-20 found 94 of 100 economists expecting the Fed to hold at 3.75-4.00% on October 28 — and all 100 expecting a hike in December, against less than half a month earlier. The market is close to the same price, with CME FedWatch at roughly 17% for October and 82.8% for December. With the Fed in blackout since October 17, here are the five dates that decide the rest of the year, what each one is priced for, and the two directions each can take.
Author  Irene Q.
Yesterday 06: 28
A Reuters poll run October 16-20 found 94 of 100 economists expecting the Fed to hold at 3.75-4.00% on October 28 — and all 100 expecting a hike in December, against less than half a month earlier. The market is close to the same price, with CME FedWatch at roughly 17% for October and 82.8% for December. With the Fed in blackout since October 17, here are the five dates that decide the rest of the year, what each one is priced for, and the two directions each can take.
placeholder
Gold Price Analysis Today | Forex Gold Analysis | XAU/USD Analysis - October 23, 2026Get the latest gold price analysis, forex gold insights, and XAU/USD analysis for October 23, 2026. Read on for the details.
Author  Mitrade
6 hours ago
Get the latest gold price analysis, forex gold insights, and XAU/USD analysis for October 23, 2026. Read on for the details.
goTop
quote