


Pershing Square Ord Shs Stock (PS) Moved Up by 7.30% on Sep 30: What Investors Need To Know
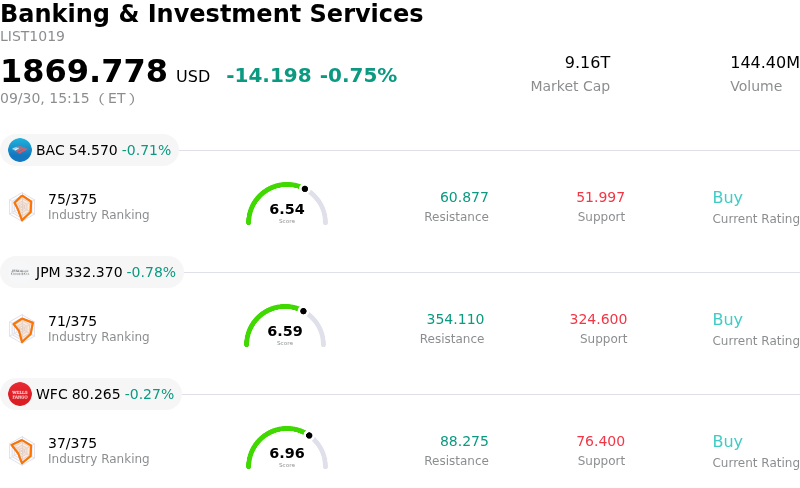
Pershing Square Ord Shs (PS) moved up by 7.30%. The Banking & Investment Services sector is down by 0.75%. The company outperformed the industry. Top 3 stocks by turnover in the sector: Bank of America Corp (BAC) down 0.71%; JPMorgan Chase & Co (JPM) down 0.78%; Wells Fargo & Co (WFC) down 0.27%.
What is driving Pershing Square Ord Shs (PS)’s stock price up today?
Pershing Square Inc. experienced strong upward momentum alongside pronounced intraday volatility, driven by sustained investor enthusiasm surrounding its expanding permanent-capital platform. Market participant confidence has been buoyed by strategic growth initiatives, most notably the seeding and launch of Pershing Square Ventures, a new permanent-capital vehicle focused on late-stage private investments. This expansion provides a clear trajectory for generating recurring management fees and expanding firmwide assets under management, reinforcing the core thesis that the company's permanent-capital model insulates it from capital redemption pressures while opening higher-margin fee channels.
Beyond product expansion, recent operational milestones and high-profile venture activity have kept institutional focus firmly on the firm. The company's prior quarterly performance exceeded Wall Street expectations, supported by solid management fee revenue and steady dividend distributions. Institutional positioning has shifted constructively following a period of post-debut consolidation, with elevated trading volumes and positive technical momentum indicators attracting trend-following capital into the stock.
Despite the upward trajectory, intraday trading remains volatile due to an active debate over valuation. A majority of Wall Street analysts maintain conservative ratings with consensus price targets positioned below current trading levels, prompting selective profit-taking when technical indicators signal overbought conditions. However, persistent buying interest on dips suggests that market participants are currently weighing long-term permanent capital scaling and fee accumulation more heavily than near-term valuation metrics.
Technical Analysis of Pershing Square Ord Shs (PS)
Technically, Pershing Square Ord Shs (PS) shows a MACD (12,26,9) value of 2.653, indicating a buy signal. The RSI at 67.292 suggests neutral condition and the Williams %R at 10.720 suggests overbought condition. Please monitor closely.
Fundamental Analysis of Pershing Square Ord Shs (PS)
Pershing Square Ord Shs (PS) is in the Banking & Investment Services industry. Its latest annual revenue is $348.77M, ranking 86 in the industry. The net profit is $249.78M, ranking 54 in the industry. Company Profile
Over the past month, multiple analysts have rated the company as Hold, with an average price target of $42.78, a high of $53.00, and a low of $36.00.
More details about Pershing Square Ord Shs (PS)
Company Specific Risks:
- Institutional Analyst Downgrade and Valuation Gap: JonesTrading downgraded Pershing Square from Buy to Hold following a rally to all-time highs near $60, emphasizing that the current stock price trades at a steep ~25% premium above the consensus Wall Street price target of approximately $41.
- Heightened Profit-Taking After Speculative Surge: The stock suffered an intraday drop of over 8% as institutional momentum investors locked in profits following a rapid multi-week rally surrounding the announcement of Pershing Square Ventures, exposing shares to sharp mean-reversion volatility.
- Fundamental Top-Line Weakness and Stretched Multiples: Operations face valuation scrutiny following a recent quarterly revenue miss of more than 27% ($54.18 million versus $74.44 million expected), leaving the stock's elevated trailing earnings multiple vulnerable during broader financial sector downturns.
- High Portfolio Concentration and Earnings Volatility: Pershing Square operates a hyper-concentrated investment strategy across fewer than 15 large-cap positions, exposing its asset base, performance fee income, and net asset value to outsized downside risk if core holdings falter.
Recommended Articles


