


Ethereum (ETHUSD) Is down 1.02% on Sep 28: What Are the Risk Factors?
Ethereum (ETHUSD) is down 1.02% at Sep 28 21:55(ET), now at $2656.31, with a 7-day down of 4.52%.
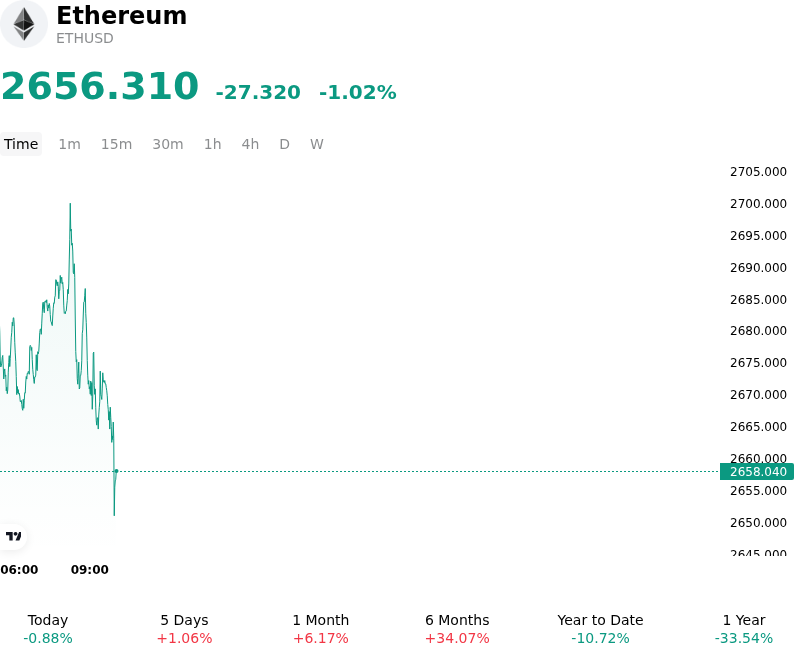
What is driving Ethereum (ETHUSD)’s stock price down today?
Ethereum experienced downside pressure as price action struggled to clear key technical overhead resistance around the 2,800 USD threshold, triggering a wave of short-term profit-taking and tactical portfolio rebalancing. Following a multi-week rally that outpaced broader market benchmarks, buyers encountered persistent sell liquidity near major technical barriers. Concurrently, broader macroeconomic headwinds, including elevated Treasury yields and cautious Federal Reserve monetary policy expectations, capped risk appetite across digital assets, prompting institutional and retail traders to trim exposure.
Derivatives market indicators pointed to an ongoing reduction in speculative leverage, reinforcing the intraday pullback. Futures open interest contracted alongside a drop in estimated leverage ratios across major derivatives exchanges, signaling that leveraged long positions were unwound rather than replaced with aggressive shorting. Negative net taker volume and a taker buy-sell ratio dipping below unity further reflected cautious positioning among short-term traders. This spot-led retracement was exacerbated by lighter spot liquidity, allowing modest selling volume to absorb buy orders at key demand zones.
Institutional participation showed signs of temporary deceleration, with spot Ethereum ETF net inflows moderating compared to earlier high-volume sessions. While long-term corporate treasury accumulation and high staking participation continue to lock up substantial liquid float on-chain, near-term capital allocation favored risk management ahead of upcoming macroeconomic data releases. Additionally, minor capital rotation into competing Layer-1 networks undergoing protocol updates diverted speculative capital away from Ethereum in the immediate term.
Despite the immediate pullback, underlying network fundamentals remain structural drivers for long-term valuation. Market participants continue to closely monitor the progress of protocol developments, such as the Glamsterdam upgrade testnet rollouts designed to enhance base-layer throughput and proposer-builder efficiency. Institutional investors interpret the current softness as a routine consolidation within a broader market cycle, though sustained holding above key moving-average supports remains critical to re-engaging momentum buyers and challenging overhead resistance once market liquidity normalizes.
Technical Analysis of Ethereum (ETHUSD)
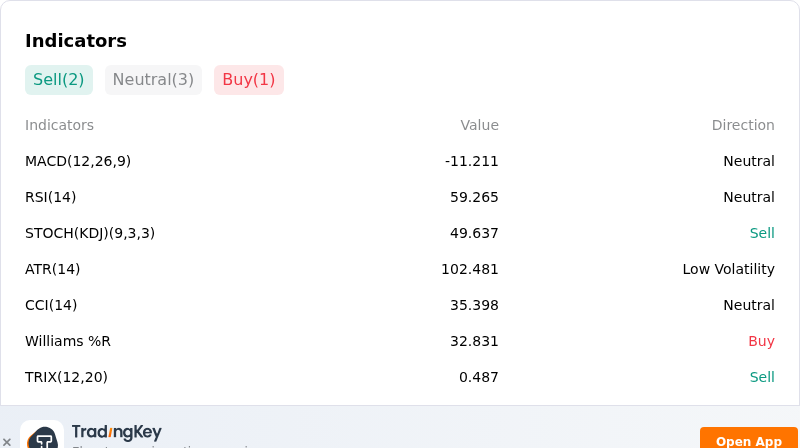
Technically, Ethereum (ETHUSD) shows a MACD (12,26,9) value of -10.513, indicating a neutral signal. The RSI at 59.833 suggests neutral condition and the Williams %R at 31.611 suggests buy condition. Please monitor closely.
More details about Ethereum (ETHUSD)
Recent Events and Risks:
- Derivatives Long Squeeze and Liquidations: A sudden rejection near multi-week highs triggered over $100 million in long position liquidations across major perpetual and futures markets, causing order book imbalances and accelerating intraday downside momentum toward $2,660.
- Heavy Overhead Resistance Rejection: Ethereum's failure to clear the critical $2,780–$2,800 psychological ceiling has shifted short-term market momentum, increasing vulnerability to a breakdown below $2,626 toward key exponential moving average support near $2,550.
- Subdued ETF Inflows and Institutional Inaction: Net allocations into spot Ethereum ETFs have slowed considerably relative to high-volume sessions, leaving spot market profit-taking and derivative unwinding unabsorbed by institutional buyers.
- Macroeconomic Risk-Off Sentiment: Fluctuations in U.S. Treasury yields and foreign exchange rates continue to restrict global dollar liquidity, weighing on risk asset appetite and keeping broad digital asset inflows constrained.
Recommended Articles


