

Quant Price Forecast: QNT rallies 350% in a week on major tokenization deal

Source Fxstreet
  • Quant is down nearly 10% on Monday, showing signs of mild easing after rallying nearly 350% last week.
  • Quant partnered with The Clearing House on Thursday, emerging as a settlement layer for tokenized deposits across 25 major US banks.
  • The technical outlook for QNT is bullish, with the price trading around a 4-year high amid strong bullish momentum.

Quant (QNT) price hovers above $250 on Monday following a parabolic rise of nearly 350% last week. The Clearing House deal positions Quant as a settlement layer across 25 major banks for tokenized deposits amid the US government's strong push for tokenized stocks and other Real-World Assets (RWAs). Retail speculation builds toward QNT, with its futures Open Interest rising to a record high of $158.80 million, indicating firm leverage-exposed participation.

Bullish speculation grows firm on tokenized deposits deal

Quant rallied nearly 350% last week, gaining strong retail demand on the announcement of a partnership with The Clearing House. The deal enables Quant to serve as the transaction layer for clearing and settling tokenized deposits across 25 major US banks, as previously reported by FXStreet. 

On the retail side, the QNT futures Open Interest (OI) surged to $158.80 million, suggesting a sharp increase in leverage-driven positional buildup. At the same time, the funding rate fluctuates, flipping to -0.0136%, suggesting a mild bearish incline among traders as the rally stretches thin.
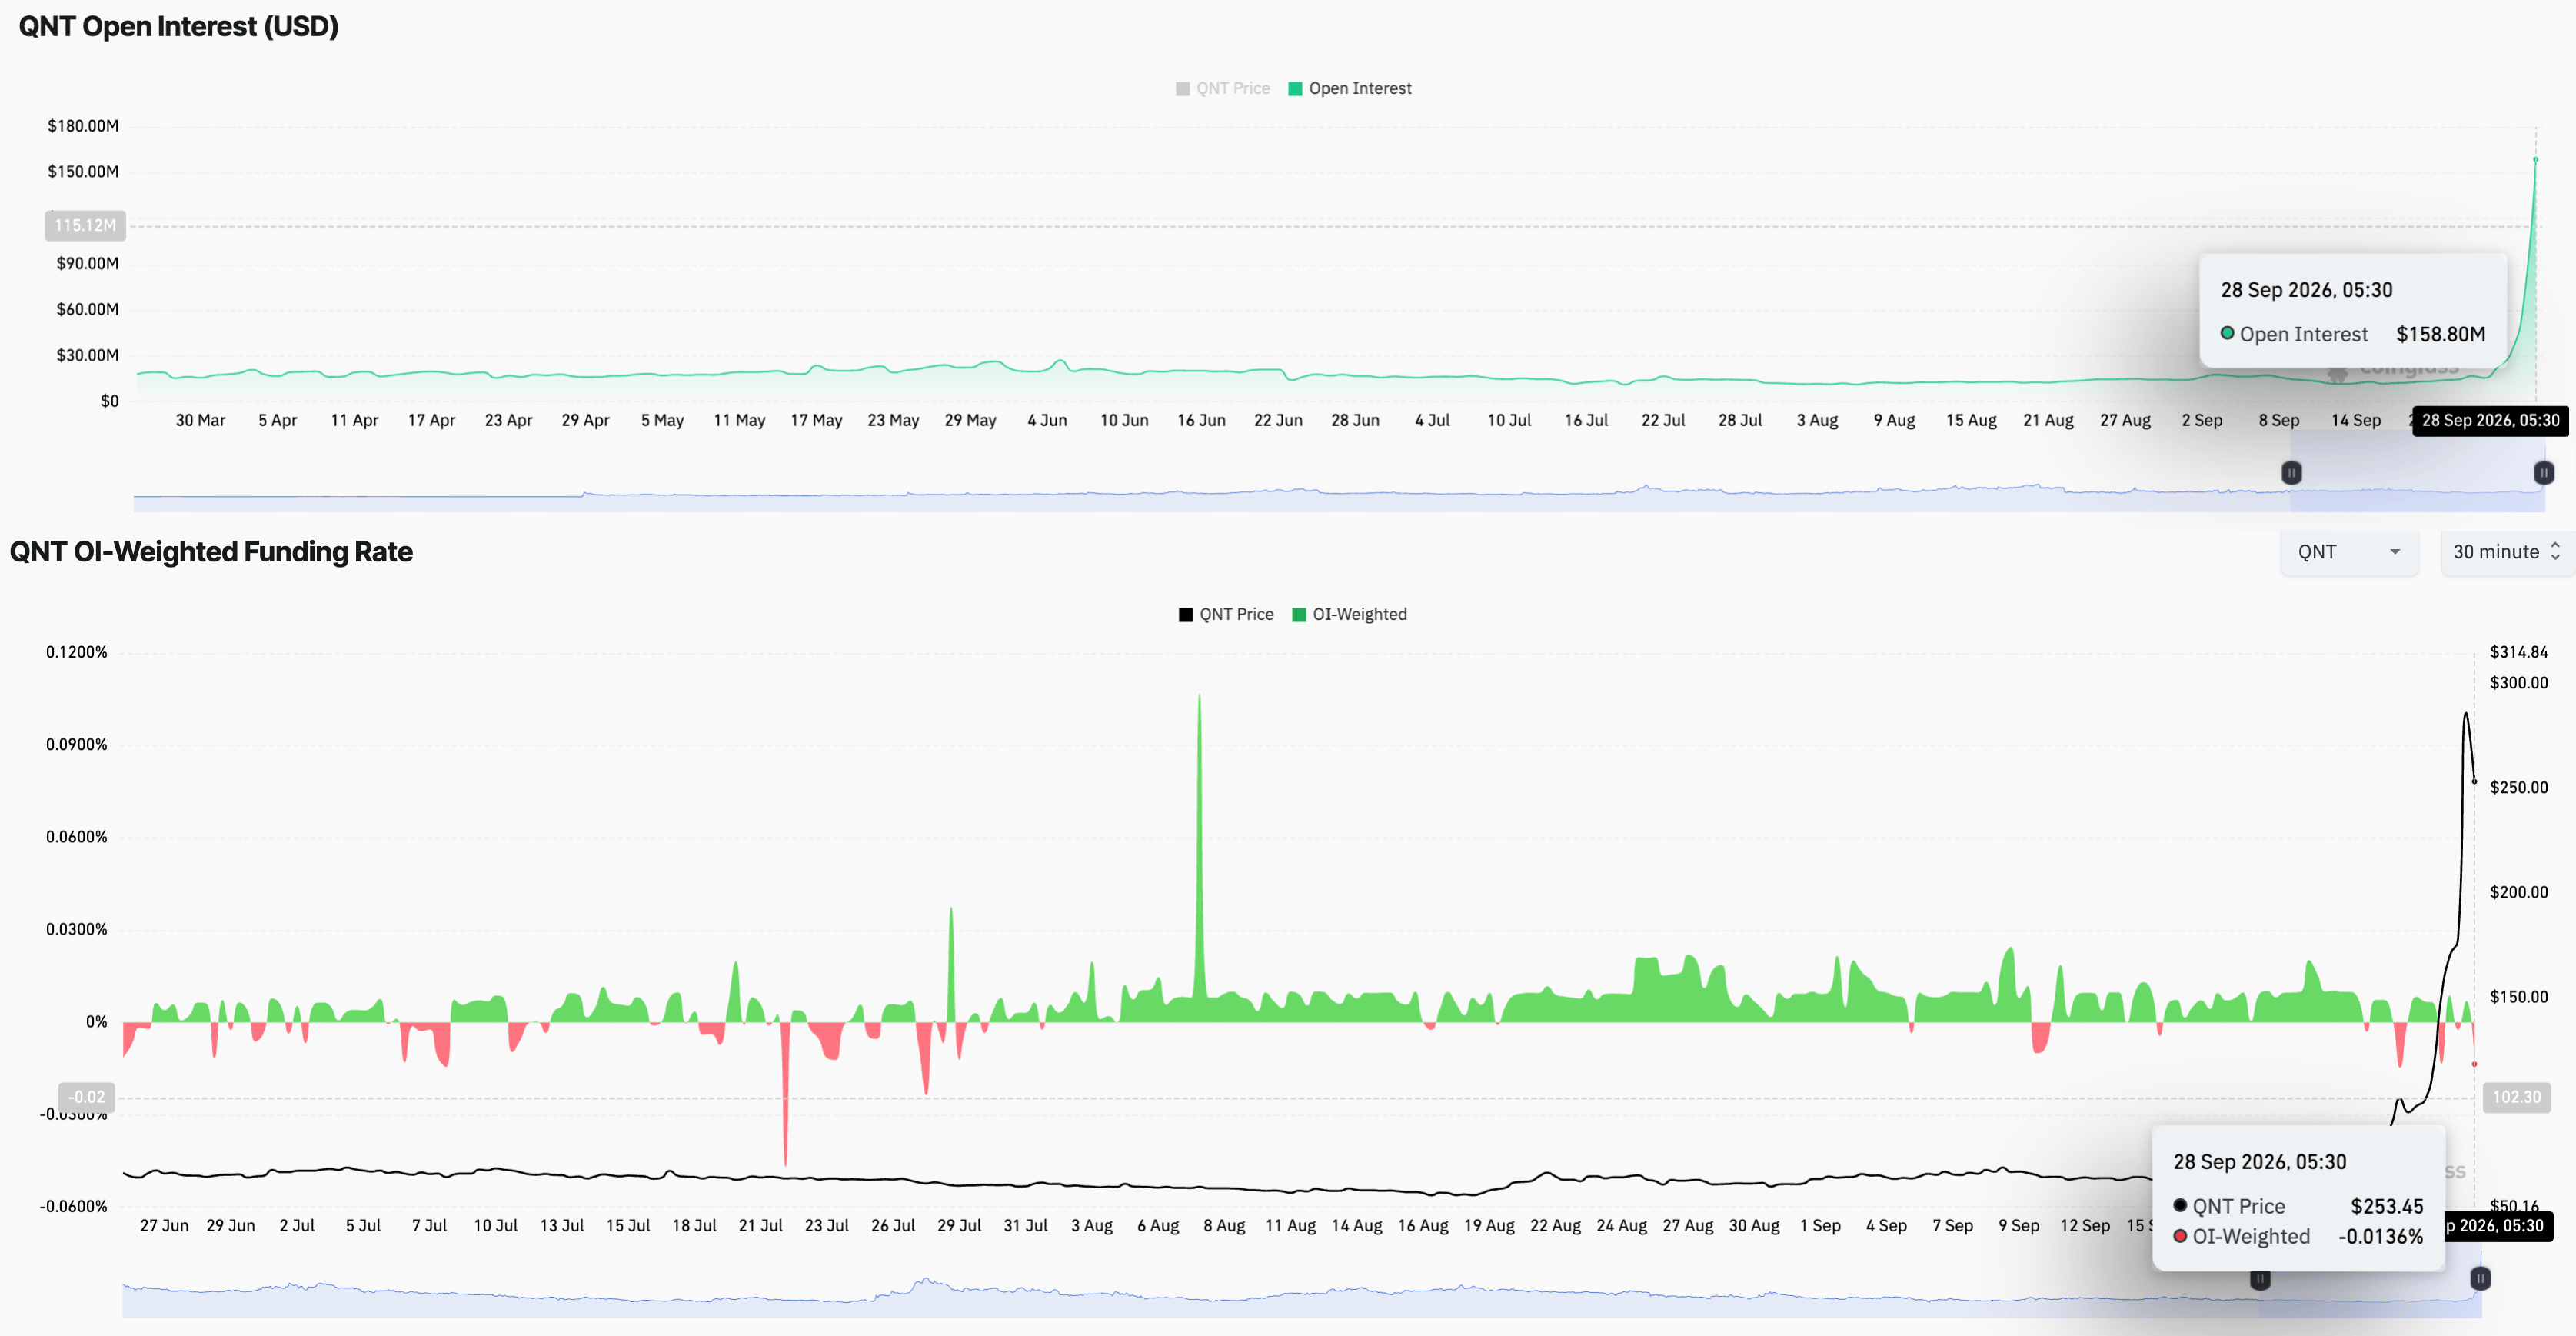
QNT derivatives data. Source: CoinGlass

Technical outlook: QNT rally steadies above $250 as bulls eye a fresh record high

Quant trades around $254 at press time on Monday, holding steady after a parabolic rise last week. QNT sits well above the major 50-, 100-, and 200-week Exponential Moving Averages (EMAs) at $87.78, $88.89 and $102.44, respectively, providing a broad underlying support zone.

The 50-week EMA crosses above the 200-week EMA, which is commonly referred to as a Golden Cross pattern, suggesting a long-term bullish trend reversal. Momentum on the week chart hits record high levels, with the Relative Strength Index (RSI) at 80, deep into the overbought territory. At the same time, the Moving Average Convergence Divergence (MACD) and signal line extend an uptrend to 26.22 and 20.85, with expanding bullish histograms, suggesting a firm control of buyers on the trend.

The Fibonacci retracement over last week's price range from $64.16 to $373.00 highlights the immediate support level at the 78.6% Fibonacci retracement level at $255, followed by the October 17, 2022 and December 2, 2024 highs around $228 and $171.70, respectively.

Looking up, QNT must surpass last week's high at $373 to test its record high of $430 set by the September 6, 2021 high. A confirmed breakout above this level could target the 127.2% Fibonacci extension level at $602.05.

Chart Analysis QNT/USDT (Binance)
QNT/USDT daily price chart.

(The technical analysis of this story was written with the help of an AI tool. Know more.)

Disclaimer: For information purposes only. Past performance is not indicative of future results.
placeholder
Gold ends three-week slide at the $4,400 line — eight straight days of ETF inflows vs a 5% 10-year and a 100 dollarSpot gold closed Friday at $4,378.39, up 0.84% on the day and about 0.8% for the week — its first weekly gain in four weeks — with the intraday high of $4,399.67 leaving it 33 cents shy of the $4,400 line. Gold ETFs have now logged eight straight sessions of inflows, but with the 10-year back above 5% and the dollar index near 100, here is what decides whether this is a reversal or a bounce.
Author  Suzie
Sep 20, Sun
Spot gold closed Friday at $4,378.39, up 0.84% on the day and about 0.8% for the week — its first weekly gain in four weeks — with the intraday high of $4,399.67 leaving it 33 cents shy of the $4,400 line. Gold ETFs have now logged eight straight sessions of inflows, but with the 10-year back above 5% and the dollar index near 100, here is what decides whether this is a reversal or a bounce.
placeholder
October hike odds climb toward 60% as Goldman and BofA both flip — what Warsh's "dose of accommodation" really changedRate futures now price roughly 55% to 62% for a 25bp hike at the October 27-28 FOMC, up from about 30% before Chair Warsh's post-meeting framing that the Fed is merely "removing some accommodation." Goldman Sachs has added an October hike to its forecast and Bank of America now sees moves in both October and December. Here is the repricing, the language behind it, and the two data points that decide it.
Author  Irene Q.
Sep 23, Wed
Rate futures now price roughly 55% to 62% for a 25bp hike at the October 27-28 FOMC, up from about 30% before Chair Warsh's post-meeting framing that the Fed is merely "removing some accommodation." Goldman Sachs has added an October hike to its forecast and Bank of America now sees moves in both October and December. Here is the repricing, the language behind it, and the two data points that decide it.
placeholder
US input costs rose at the fastest pace in four years — the September flash PMI beat is an inflation story, not a growth storyUS September flash PMIs came in far above expectations, with the composite at 58.4, a five-year high. But the detail that moved markets was input cost inflation at its fastest since October 2022, driven by fuel, transport and supply shortages. Brent is back above $100 and the 10-year Treasury yield has hit its highest since 2007.
Author  Suzie
Sep 24, Thu
US September flash PMIs came in far above expectations, with the composite at 58.4, a five-year high. But the detail that moved markets was input cost inflation at its fastest since October 2022, driven by fuel, transport and supply shortages. Brent is back above $100 and the 10-year Treasury yield has hit its highest since 2007.
placeholder
Brent edges toward $99 as Trump rejects Iran's Hormuz proposal — why the war-risk premium won't rebuildBrent crude rose 0.92% to $98.51 and WTI gained 1.15% to $93.51 after President Trump rejected Iran's seven-day proposal to reopen the Strait of Hormuz. But both benchmarks remain about 12% below their early-September highs, because supply never actually stopped. Hormuz flows ran at 33.7 million barrels this week, in line with the prior week, and Saudi Arabia's East-West pipeline restarted on September 22.
Author  Suzie
22 hours ago
Brent crude rose 0.92% to $98.51 and WTI gained 1.15% to $93.51 after President Trump rejected Iran's seven-day proposal to reopen the Strait of Hormuz. But both benchmarks remain about 12% below their early-September highs, because supply never actually stopped. Hormuz flows ran at 33.7 million barrels this week, in line with the prior week, and Saudi Arabia's East-West pipeline restarted on September 22.
placeholder
Four jobs reports in five days: what JOLTS, ADP, claims and the September payrolls mean for the October Fed decisionThe US labour market faces its densest data week of the month. JOLTS job openings land Tuesday (7.2 million expected), ADP on Wednesday (70,000 expected), initial claims on Thursday and the September non-farm payrolls on Friday (100,000 expected, down from 162,000). Markets price a 64%-70% chance of another quarter-point Fed hike on October 28. The dollar index sits at 100.77 and the S&P 500 at 7,729.8.
Author  Mitrade
22 hours ago
The US labour market faces its densest data week of the month. JOLTS job openings land Tuesday (7.2 million expected), ADP on Wednesday (70,000 expected), initial claims on Thursday and the September non-farm payrolls on Friday (100,000 expected, down from 162,000). Markets price a 64%-70% chance of another quarter-point Fed hike on October 28. The dollar index sits at 100.77 and the S&P 500 at 7,729.8.
goTop
quote