

Solana (SOLUSD) Is down 2.12% on Sep 20: Why It Happened

Source Tradingkey

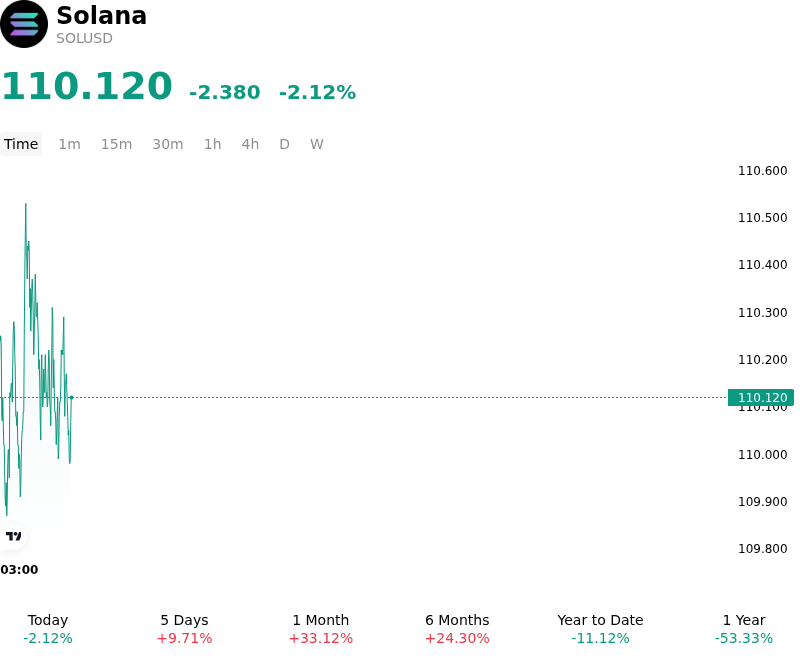
Solana (SOLUSD) is down 2.12% at Sep 20 20:25(ET), now at $110.12, with a 7-day up of 9.59%.
SummaryOverview

What is driving Solana (SOLUSD)’s stock price down today?

Solana experienced a moderate intraday pullback as profit-taking and leverage consolidation took hold following a multi-session rally that pushed the asset through psychological resistance levels above $110. After intense derivative-driven momentum and short squeezes spurred gains earlier in the week—catalyzed by the activation of the network's SIMD 0525 performance upgrade that reduced target block slot times to 250 milliseconds—capital flows naturally normalized. Short-term market participants trimmed exposure near major overhead supply zones, leading to a temporary retracement in spot prices.

Institutional engagement remains anchored by multi-week net inflows into spot Solana exchange-traded funds, highlighted by persistent demand for staking-enabled products such as Bitwise's BSOL. However, intraday liquidity dynamics reflected a classic exhaustion of immediate buy-side volume after futures open interest reached elevated levels. Derivatives markets witnessed a necessary cooling period as long positions unwound and funding rates settled back toward neutral levels, stabilizing speculative leverage across major perpetual exchanges.

Macroeconomic conditions also contributed to the cautious trading environment. Shifts in Federal Reserve policy expectations and elevated benchmark Treasury yields kept broader risk asset appetite constrained, limiting aggressive upside follow-through across high-beta digital assets. While structural network enhancements and growing stablecoin activity continue to support long-term adoption metrics, immediate price action reflects a healthy liquidity repricing as the market digests recent gains and establishes fresh support.

Investors continue to monitor global macroeconomic risk sentiment, persistent regulatory developments surrounding digital asset classification, and spot ETF net flow consistency. Near-term price stability will largely depend on whether institutional inflows can absorb derivative unwinding and hold primary structural technical floors.

Technical Analysis of Solana (SOLUSD)

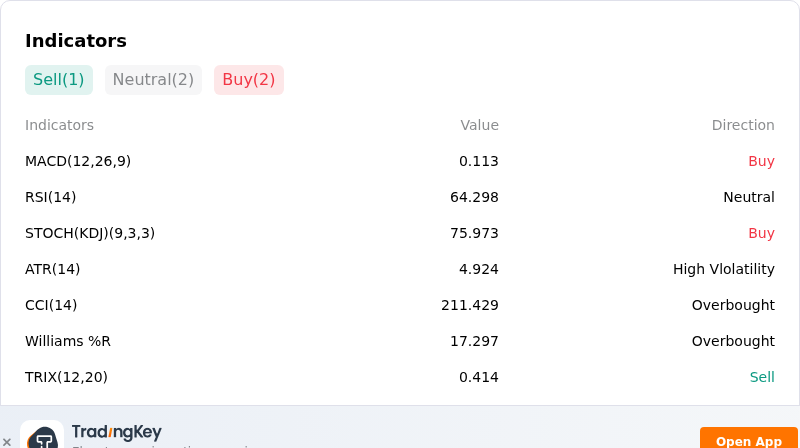
Technically, Solana (SOLUSD) shows a MACD (12,26,9) value of 0.113, indicating a buy signal. The RSI at 64.298 suggests neutral condition and the Williams %R at 17.297 suggests overbought condition. Please monitor closely.
IndicatorAnalysis

More details about Solana (SOLUSD)

Recent Events and Risks:

  • Derivatives Imbalance and Liquidation Vulnerability: SOL futures trading volume has expanded to over nine times spot turnover, driving open interest to nearly $5.8 billion and creating a heavily leveraged market structure vulnerable to sharp intraday liquidation cascades upon sudden price pullbacks.
  • Overhead Resistance Rejection and Key Support Risks: After pushing toward the pivotal $110–$112 resistance zone, SOL faces selling pressure; a sustained rejection risks a drop below the psychological $100 level toward the $96 support shelf, where a breakdown could accelerate stop-loss selling toward $92.
  • Regulatory Friction and Macro Policy Tightening: Market-wide risk appetite for high-beta Layer-1 assets has been dampened following the U.S. Senate's failure to advance the CLARITY Act alongside the Federal Reserve's recent 25-basis-point interest rate hike, elevating macro-driven headwinds for altcoins.
  • Inconsistent Institutional Spot ETF Inflows: Capital commitment into Solana spot ETFs remains uneven, marked by single-day net outflows in products like the Grayscale Solana Trust (GSOL) and a sharp deceleration in net weekly fund inflows, limiting sustained passive buying support.
Disclaimer: For information purposes only. Past performance is not indicative of future results.
placeholder
Fed hike odds near 90% into Wednesday's decision — how to trade the dollar, gold and the S&P 500A 0.3% monthly core CPI print has lifted the market-implied probability of a 25bp Fed hike on 16 September to roughly 86.5% ~ 90%, which would be the first increase since July 2023. Here is the decision timeline, the pricing versus the forecasts, both scenarios, and the key levels for the dollar, gold and the S&P 500.
Author  Suzie
Sep 14, Mon
A 0.3% monthly core CPI print has lifted the market-implied probability of a 25bp Fed hike on 16 September to roughly 86.5% ~ 90%, which would be the first increase since July 2023. Here is the decision timeline, the pricing versus the forecasts, both scenarios, and the key levels for the dollar, gold and the S&P 500.
placeholder
Bitcoin falls below $75,000 as the CLARITY Act fails in the Senate — what the vote means for cryptoThe US Senate blocked the Digital Asset Market CLARITY Act in a 49-50 procedural vote, sending Bitcoin briefly below $75,000 — its biggest one-day drop since June. Ethereum fell more than 8%, Coinbase slid 10% and $75 billion of crypto market value evaporated. Here is what the vote was, why it failed, and the levels that matter now.
Author  Suzie
Sep 16, Wed
The US Senate blocked the Digital Asset Market CLARITY Act in a 49-50 procedural vote, sending Bitcoin briefly below $75,000 — its biggest one-day drop since June. Ethereum fell more than 8%, Coinbase slid 10% and $75 billion of crypto market value evaporated. Here is what the vote was, why it failed, and the levels that matter now.
placeholder
Dollar index tops 100 for the first time since July as the Fed's hawkish dot plot sinks inThe U.S. dollar index broke back above 100 for the first time since 31 July after the Fed delivered its first rate hike since 2023, with the dot plot showing 16 of 18 officials expect at least one more increase this year. Here are the levels that matter for DXY, the currencies feeling it most, and what to watch next.
Author  Irene Q.
Sep 17, Thu
The U.S. dollar index broke back above 100 for the first time since 31 July after the Fed delivered its first rate hike since 2023, with the dot plot showing 16 of 18 officials expect at least one more increase this year. Here are the levels that matter for DXY, the currencies feeling it most, and what to watch next.
placeholder
Gold rebounds to near $4,350 on weaker US Dollar, falling oil pricesGold price (XAU/USD) rises to near $4,345 during the early Asian session on Friday. The precious metal rebounds from a six-week low amid falling oil prices and a weaker US Dollar (USD). Traders continue to assess the latest Federal Reserve (Fed) rate hike and policy cues.
Author  FXStreet
Sep 18, Fri
Gold price (XAU/USD) rises to near $4,345 during the early Asian session on Friday. The precious metal rebounds from a six-week low amid falling oil prices and a weaker US Dollar (USD). Traders continue to assess the latest Federal Reserve (Fed) rate hike and policy cues.
placeholder
US to delay new "overcapacity" tariffs on China — what the pause means for trade, inflation and the dollarWashington is expected to hold off announcing new tariffs over Chinese "overcapacity" until after the 24 September summit, according to Bloomberg. The postponed plan would have added 7.5% to Chinese goods, taking second-term US tariffs to around 20%. Here is what is on the table, and what a deal versus no deal would mean for the yuan, Hong Kong equities and the dollar.
Author  Mitrade
Sep 18, Fri
Washington is expected to hold off announcing new tariffs over Chinese "overcapacity" until after the 24 September summit, according to Bloomberg. The postponed plan would have added 7.5% to Chinese goods, taking second-term US tariffs to around 20%. Here is what is on the table, and what a deal versus no deal would mean for the yuan, Hong Kong equities and the dollar.
goTop
quote