

Ethereum (ETHUSD) Is down 1.11% on Sep 20: What Do On-Chain Data and Market Sentiment Show?

Source Tradingkey

Ethereum (ETHUSD) is down 1.11% at Sep 20 22:40(ET), now at $2604.22, with a 7-day up of 3.74%.
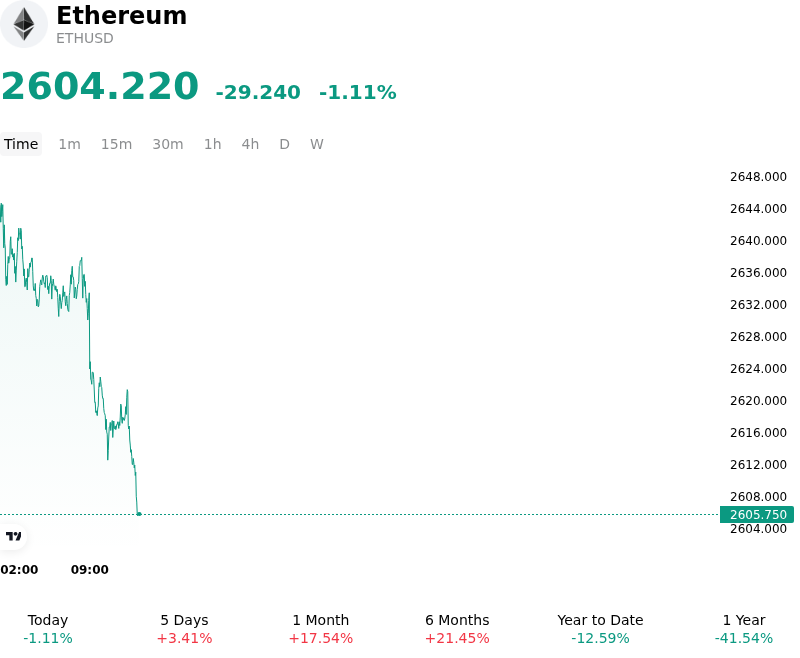
SummaryOverview

What is driving Ethereum (ETHUSD)’s stock price down today?

The moderate decline in Ethereum reflects a broader risk-off adjustment driven by a tightening macro liquidity environment and temporary profit-taking following a retest of key upper resistance levels. Macroeconomic headwinds surged into focus as the Federal Reserve enacted a rate increase to counter persistent inflationary pressures. Accompanied by elevated U.S. Treasury yields and a resilient U.S. Dollar, higher risk-free yields tightened global dollar liquidity. This shift altered real yield expectations, forcing institutional portfolios to reduce risk-budget allocations across high-beta digital assets and dampening immediate risk appetite.

At the ecosystem level, capital inflows faced friction following mixed institutional spot ETF demand and regulatory delays. The failure of key U.S. digital asset market-structure legislation to clear procedural votes removed an anticipated policy catalyst that institutional allocators had priced in for statutory clarity. Although regulatory agencies introduced temporary exemptions permitting permissioned liquidity pools for tokenized real-world assets, the legislative setback introduced lingering policy uncertainty. Simultaneously, spot Ethereum ETFs experienced inconsistent daily flow patterns, with net outflow sessions dampening spot buying momentum near technical resistance and prompting tactical profit-taking.

Derivatives market positioning also contributed to the soft intraday tone, as elevated open interest invited selective deleveraging and long liquidation flushes. Despite the downside pressure, structural supply dynamics remain supportive over a longer horizon. The proportion of circulating supply locked in network staking contracts continues to absorb available sell-side liquidity, paired with reduced spot exchange reserves. Moving forward, institutional investors remain focused on post-hike Federal Reserve guidance, the trajectory of net spot ETF flows, and protocol testnet developments to gauge structural market direction.

Technical Analysis of Ethereum (ETHUSD)

Technically, Ethereum (ETHUSD) shows a MACD (12,26,9) value of -4.807, indicating a neutral signal. The RSI at 63.214 suggests neutral condition and the Williams %R at 18.982 suggests overbought condition. Please monitor closely.
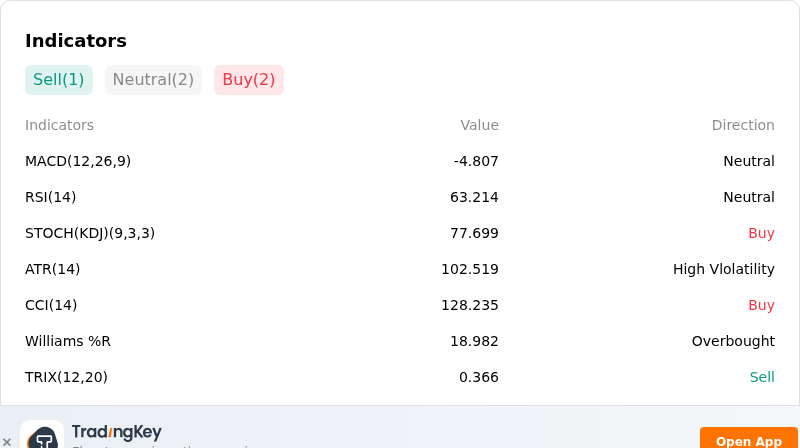
IndicatorAnalysis

More details about Ethereum (ETHUSD)

Recent Events and Risks:

  • Institutional Spot ETF Capital Redemptions: U.S. spot Ethereum ETFs recorded heavy net outflows exceeding $400 million over recent trading sessions, driven by substantial redemptions in BlackRock's ETHA and Bitwise's ETHW, signaling near-term institutional de-risking and eroding spot-market buy liquidity.
  • Regulatory Legislative Failure: The failure of the U.S. Senate to advance key crypto regulatory legislation, specifically the CLARITY Act, re-introduced heightened regulatory uncertainty, triggering immediate broad-based sell-offs across ETH and digital asset markets.
  • Macroeconomic Tightening and Treasury Yield Pressure: Escalating concerns over hawkish Federal Reserve interest rate policy alongside rising U.S. Treasury yields have tightened fiat market liquidity and fueled risk-off sentiment across speculative asset classes.
  • Derivatives Long Liquidations and Technical Support Retests: A sharp wave of forced long liquidations surpassing $180 million has heightened derivatives market fragility, exposing ETH to cascading downside pressure and potential liquidation sweeps if critical support levels between $2,380 and $2,266 break.
Disclaimer: For information purposes only. Past performance is not indicative of future results.
placeholder
Fed hike odds near 90% into Wednesday's decision — how to trade the dollar, gold and the S&P 500A 0.3% monthly core CPI print has lifted the market-implied probability of a 25bp Fed hike on 16 September to roughly 86.5% ~ 90%, which would be the first increase since July 2023. Here is the decision timeline, the pricing versus the forecasts, both scenarios, and the key levels for the dollar, gold and the S&P 500.
Author  Suzie
Sep 14, Mon
A 0.3% monthly core CPI print has lifted the market-implied probability of a 25bp Fed hike on 16 September to roughly 86.5% ~ 90%, which would be the first increase since July 2023. Here is the decision timeline, the pricing versus the forecasts, both scenarios, and the key levels for the dollar, gold and the S&P 500.
placeholder
Bitcoin falls below $75,000 as the CLARITY Act fails in the Senate — what the vote means for cryptoThe US Senate blocked the Digital Asset Market CLARITY Act in a 49-50 procedural vote, sending Bitcoin briefly below $75,000 — its biggest one-day drop since June. Ethereum fell more than 8%, Coinbase slid 10% and $75 billion of crypto market value evaporated. Here is what the vote was, why it failed, and the levels that matter now.
Author  Suzie
Sep 16, Wed
The US Senate blocked the Digital Asset Market CLARITY Act in a 49-50 procedural vote, sending Bitcoin briefly below $75,000 — its biggest one-day drop since June. Ethereum fell more than 8%, Coinbase slid 10% and $75 billion of crypto market value evaporated. Here is what the vote was, why it failed, and the levels that matter now.
placeholder
Dollar index tops 100 for the first time since July as the Fed's hawkish dot plot sinks inThe U.S. dollar index broke back above 100 for the first time since 31 July after the Fed delivered its first rate hike since 2023, with the dot plot showing 16 of 18 officials expect at least one more increase this year. Here are the levels that matter for DXY, the currencies feeling it most, and what to watch next.
Author  Irene Q.
Sep 17, Thu
The U.S. dollar index broke back above 100 for the first time since 31 July after the Fed delivered its first rate hike since 2023, with the dot plot showing 16 of 18 officials expect at least one more increase this year. Here are the levels that matter for DXY, the currencies feeling it most, and what to watch next.
placeholder
Gold rebounds to near $4,350 on weaker US Dollar, falling oil pricesGold price (XAU/USD) rises to near $4,345 during the early Asian session on Friday. The precious metal rebounds from a six-week low amid falling oil prices and a weaker US Dollar (USD). Traders continue to assess the latest Federal Reserve (Fed) rate hike and policy cues.
Author  FXStreet
Sep 18, Fri
Gold price (XAU/USD) rises to near $4,345 during the early Asian session on Friday. The precious metal rebounds from a six-week low amid falling oil prices and a weaker US Dollar (USD). Traders continue to assess the latest Federal Reserve (Fed) rate hike and policy cues.
placeholder
US to delay new "overcapacity" tariffs on China — what the pause means for trade, inflation and the dollarWashington is expected to hold off announcing new tariffs over Chinese "overcapacity" until after the 24 September summit, according to Bloomberg. The postponed plan would have added 7.5% to Chinese goods, taking second-term US tariffs to around 20%. Here is what is on the table, and what a deal versus no deal would mean for the yuan, Hong Kong equities and the dollar.
Author  Mitrade
Sep 18, Fri
Washington is expected to hold off announcing new tariffs over Chinese "overcapacity" until after the 24 September summit, according to Bloomberg. The postponed plan would have added 7.5% to Chinese goods, taking second-term US tariffs to around 20%. Here is what is on the table, and what a deal versus no deal would mean for the yuan, Hong Kong equities and the dollar.
goTop
quote