

Bitcoin (BTCUSD) Suddenly Goes up 1.02% on Sep 17: What's Driving This

Source Tradingkey

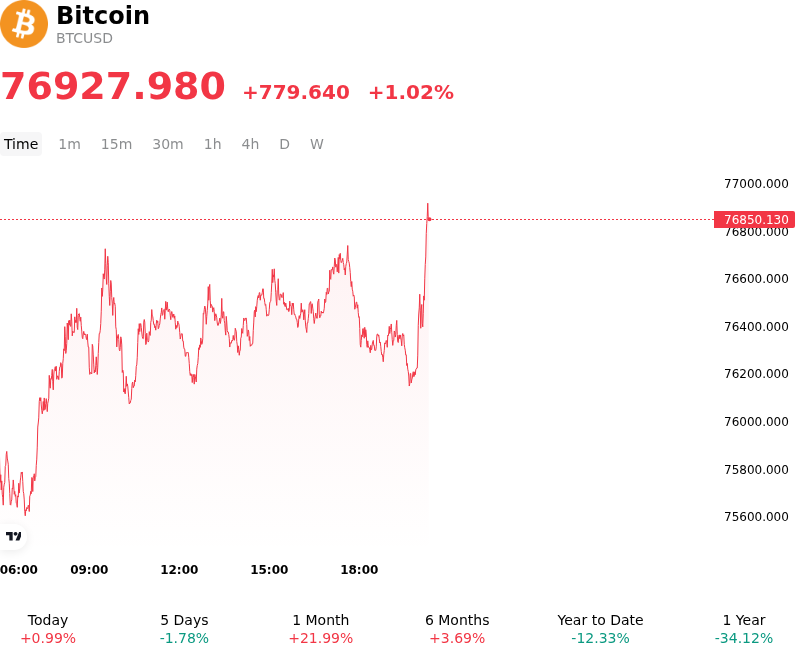
Bitcoin (BTCUSD) is up 1.02% at Sep 17 08:20(ET), now at $76927.98, with a 7-day down of 0.40%.
SummaryOverview

What is driving Bitcoin (BTCUSD)’s stock price up today?

Bitcoin advanced during the session as digital asset markets demonstrated macro resilience, stabilizing above key technical support levels following the Federal Reserve's monetary policy decision. The Federal Open Market Committee delivered a widely anticipated 25-basis-point rate increase, bringing the federal funds target range to 3.75% to 4.00%. Because fixed-income derivatives had already priced in the quarter-point tightening prior to the meeting, the formal announcement removed immediate policy uncertainty. While traditional equities experienced downward pressure from hawkish dot-plot projections and firming Treasury yields, Bitcoin decoupled from broader risk assets as institutional buyers stepped in to absorb selling liquidity near key support zones.

The rebound was further reinforced by derivatives market positioning and short-covering activity. Prior to the central bank decision, cautious positioning and precautionary deleveraging had pushed spot prices toward short-term oversold conditions. As post-meeting volatility normalized without triggering systemic liquidations, systematic trading strategies and spot desk accumulation drove prices higher. Although spot Bitcoin exchange-traded funds recorded temporary capital outflows in the sessions leading up to the announcement, underlying institutional demand helped cushion short-term redemptions and stabilize order book depth.

On the regulatory front, market participants continued to digest legislative updates regarding U.S. digital asset policy frameworks, including procedural votes on market structure legislation. While near-term legislative delays introduced temporary friction, institutional market participants remained focused on broader macro liquidity conditions and structural adoption trends. Overall, Bitcoin's positive price action amid tightening monetary policy underscores its growing structural resilience, though institutional traders continue to monitor spot ETF flows, Treasury yield trajectories, and global macroeconomic conditions for sustained directional momentum.

Technical Analysis of Bitcoin (BTCUSD)

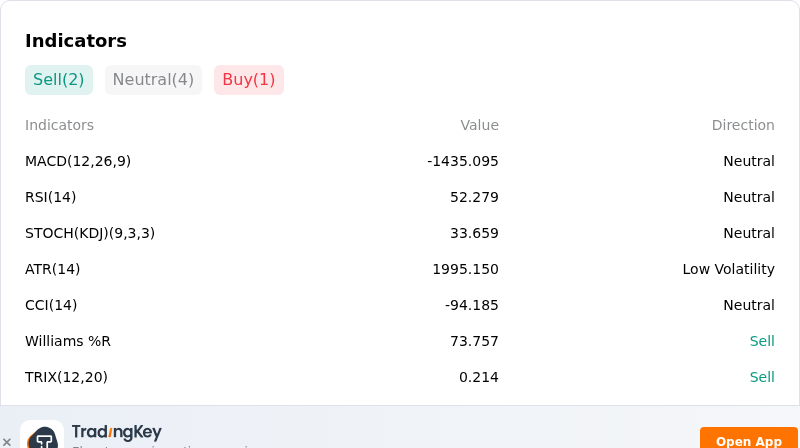
Technically, Bitcoin (BTCUSD) shows a MACD (12,26,9) value of -1435.095, indicating a neutral signal. The RSI at 52.279 suggests neutral condition and the Williams %R at 73.757 suggests sell condition. Please monitor closely.
IndicatorAnalysis

More details about Bitcoin (BTCUSD)

Recent Events and Risks:

  • Legislative and Regulatory Stagnation: The U.S. Senate failed to advance the Digital Asset Market Clarity Act (CLARITY Act) in a procedural vote, keeping clear federal regulatory guidelines in limbo and unwinding policy-driven momentum.
  • Sharp Institutional Spot ETF Outflows: U.S.-listed spot Bitcoin ETFs experienced single-day net outflows of over $450 million, dominated by heavy redemptions in major funds like Fidelity's FBTC and BlackRock's IBIT, highlighting diminishing institutional demand.
  • Derivatives Long Liquidation Cascades: A sharp pullback triggered over $570 million in forced long position liquidations across crypto derivatives markets, leaving remaining leveraged accounts exposed to secondary unwinds if critical support fails.
  • Macro Tightening and Yield Pressure: The Federal Reserve's latest interest rate hike and elevated Treasury yields continue to strengthen risk-off sentiment, raising the opportunity cost of holding high-beta digital assets like Bitcoin.
Disclaimer: For information purposes only. Past performance is not indicative of future results.
placeholder
Fed hike odds near 90% into Wednesday's decision — how to trade the dollar, gold and the S&P 500A 0.3% monthly core CPI print has lifted the market-implied probability of a 25bp Fed hike on 16 September to roughly 86.5% ~ 90%, which would be the first increase since July 2023. Here is the decision timeline, the pricing versus the forecasts, both scenarios, and the key levels for the dollar, gold and the S&P 500.
Author  Suzie
Sep 14, Mon
A 0.3% monthly core CPI print has lifted the market-implied probability of a 25bp Fed hike on 16 September to roughly 86.5% ~ 90%, which would be the first increase since July 2023. Here is the decision timeline, the pricing versus the forecasts, both scenarios, and the key levels for the dollar, gold and the S&P 500.
placeholder
【Daily Brief】10-year Treasury yield briefly tops 5%, S&P 500 slips to 7,602 and the dollar firms at 99.3 as the Fed's decision eve beginsThe 10-year Treasury yield touched 5.014% on Monday — its first print above 5% since October 2023 — while the S&P 500 closed 0.48% lower at 7,619.98 and the dollar index firmed to 99.3. Here is the full market wrap ahead of Wednesday's FOMC decision, the dot plot and the August retail sales report, plus today's CLARITY Act Senate vote.
Author  Irene Q.
Sep 15, Tue
The 10-year Treasury yield touched 5.014% on Monday — its first print above 5% since October 2023 — while the S&P 500 closed 0.48% lower at 7,619.98 and the dollar index firmed to 99.3. Here is the full market wrap ahead of Wednesday's FOMC decision, the dot plot and the August retail sales report, plus today's CLARITY Act Senate vote.
placeholder
Silver breaks $64 as precious metals rebound — can gold hold the $4,280 line into the Fed decision?Silver has climbed back above $64 an ounce for the first time this week, leading a broad rebound across precious metals hours before the Federal Reserve delivers what is expected to be its first rate hike since 2023. Spot silver was last at $64.64, up 1.49% on the day, while gold reclaimed $4,300 and platinum and palladium both advanced. The question now is whether the bounce is a genuine turn — or a pause before the Fed's dot plot decides the next move.
Author  Suzie
Yesterday 08: 40
Silver has climbed back above $64 an ounce for the first time this week, leading a broad rebound across precious metals hours before the Federal Reserve delivers what is expected to be its first rate hike since 2023. Spot silver was last at $64.64, up 1.49% on the day, while gold reclaimed $4,300 and platinum and palladium both advanced. The question now is whether the bounce is a genuine turn — or a pause before the Fed's dot plot decides the next move.
placeholder
Dow drops 631 points as the Fed hikes — but futures are rebounding: what's next for US stocks?The Dow fell 631 points and the S&P 500 closed below 7,600 after the Fed hiked rates for the first time since 2023, with the dot plot showing 16 of 18 officials expect more tightening. Asia-session futures are already recovering — here are the levels and analyst views that decide whether 7,500 holds.
Author  Irene Q.
10 hours ago
The Dow fell 631 points and the S&P 500 closed below 7,600 after the Fed hiked rates for the first time since 2023, with the dot plot showing 16 of 18 officials expect more tightening. Asia-session futures are already recovering — here are the levels and analyst views that decide whether 7,500 holds.
placeholder
Dollar index tops 100 for the first time since July as the Fed's hawkish dot plot sinks inThe U.S. dollar index broke back above 100 for the first time since 31 July after the Fed delivered its first rate hike since 2023, with the dot plot showing 16 of 18 officials expect at least one more increase this year. Here are the levels that matter for DXY, the currencies feeling it most, and what to watch next.
Author  Irene Q.
10 hours ago
The U.S. dollar index broke back above 100 for the first time since 31 July after the Fed delivered its first rate hike since 2023, with the dot plot showing 16 of 18 officials expect at least one more increase this year. Here are the levels that matter for DXY, the currencies feeling it most, and what to watch next.
goTop
quote