


Ripple Price Forecast: XRP struggles to recover as retail demand fades
- XRP holds support at the 50-day EMA, but the 200-day EMA may limit recovery.
- XRP derivatives market softens as perpetual futures Open Interest falls to 2.12 billion XRP.
- XRP bulls battle to regain control, while momentum indicators remain downward, weighing on price action.
Ripple (XRP) remains in bearish hands on Thursday, trading near $1.30 while bulls defend a short-term moving average support cluster. Since Monday’s uptick to $1.50, the token has continued to face headwinds, primarily because the United States (US) Senate failed to advance the CLARITY Act and the Federal Reserve (Fed) raised interest rates by 25 basis points to the 3.75%-4.00% range.
Despite the regulatory setback, Ripple said XRP is legally grounded thanks to its long court battle with the Securities and Exchange Commission (SEC), whose ruling established that the token is not a security.
“The bottom line is straightforward: Ripple and XRP stand on settled ground. That legal clarity is a very meaningful advantage for Ripple, particularly as the broader US digital asset market continues to operate without a durable statutory framework that the CLARITY Act could have provided,” Ripple stated in a recent article.
XRP derivatives soften as recovery struggles
The uptake of XRP derivatives has dwindled in the last few days, with futures Open Interest (OI) falling to 2.12 billion XRP on Thursday, down from 2.25 billion the day before. This decline comes against a backdrop of a steady uptrend, with OI reaching 2.78 billion on August 15, undermining prevailing retail demand.
If cooling continues, recovery could become an uphill task, leaving XRP vulnerable to headwinds amid macro uncertainty and reduced upside catalysts in the broader crypto market.
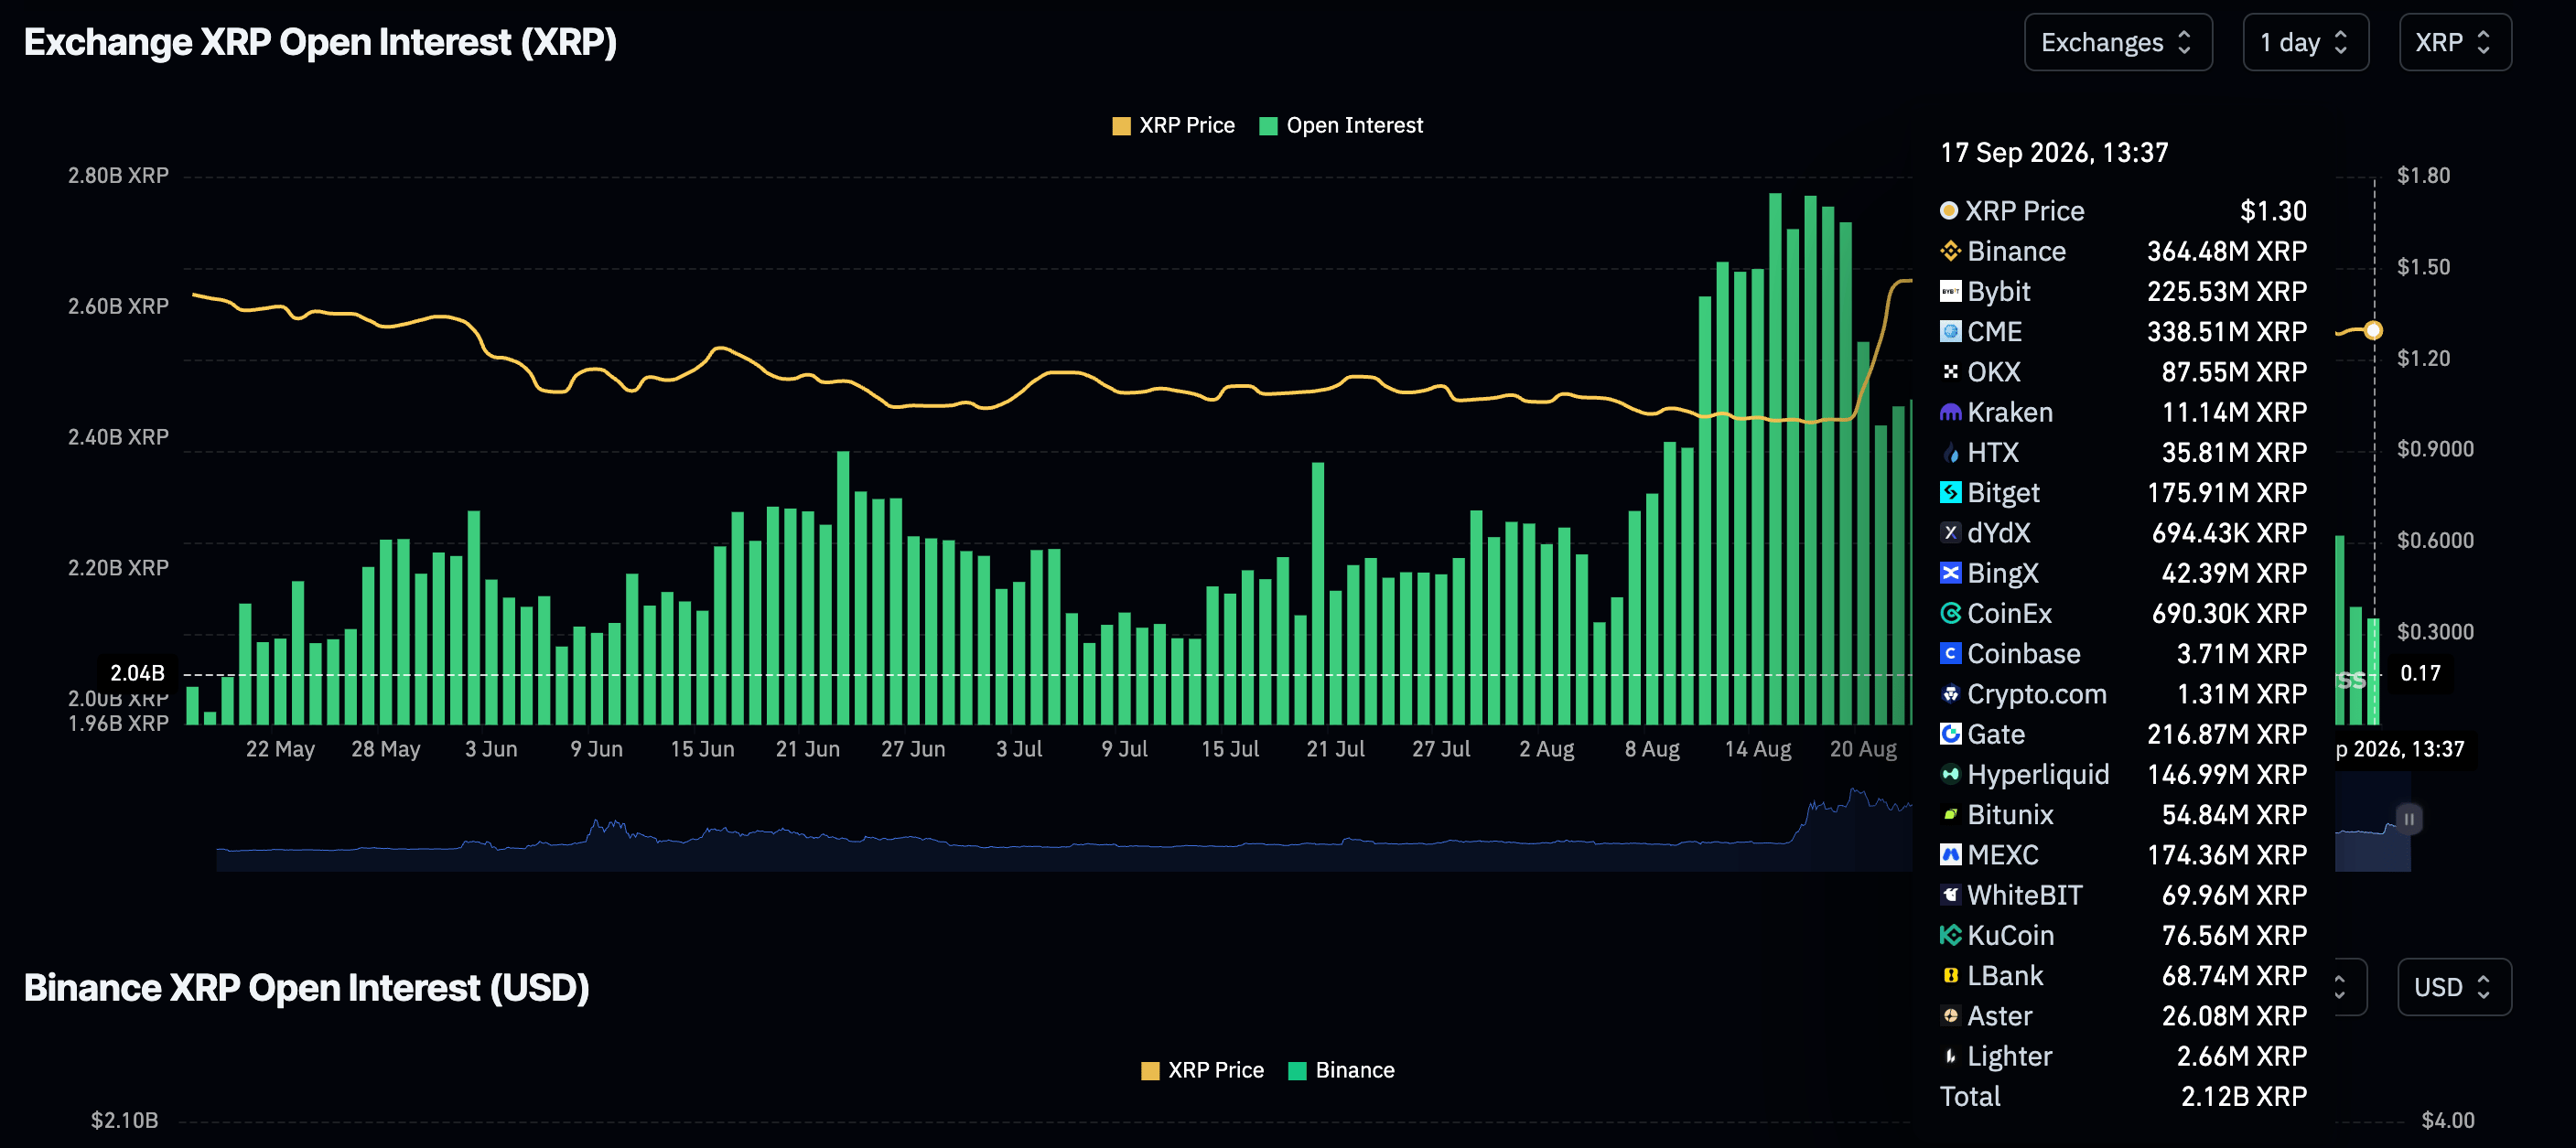
Still, XRP shows resilience after the expected Fed rate hike, which was broadly priced in. Investors should temper expectations of a sharp recovery toward $1.50, as the rate hike's impact could be delayed while risk-asset markets react to higher borrowing costs and potentially lower liquidity.
“The Fed’s growth outlook was revised higher, which suggests policymakers are not seeing an economy that is close to breaking,” Markus Levin, the co-founder of XYO, said in an emailed comment, adding, “if inflation starts moving lower, there is still a path for the Fed to pause without needing to push rates materially higher.”
Technical analysis: XRP bulls defend moving average support
XRP sits above a moving average cluster formed by the 50-day and 100-day Exponential Moving Averages (EMAs) between roughly $1.28 and $1.26, while the 200-day EMA at $1.36 caps upside movement.
The Moving Average Convergence Divergence (MACD) indicator has slipped further below zero, with its line under the signal and a negative, slightly expanding histogram, hinting at waning upside momentum. At the same time, the Relative Strength Index (RSI) at 47 sits near the midline, reinforcing a consolidative bias rather than a directional push.
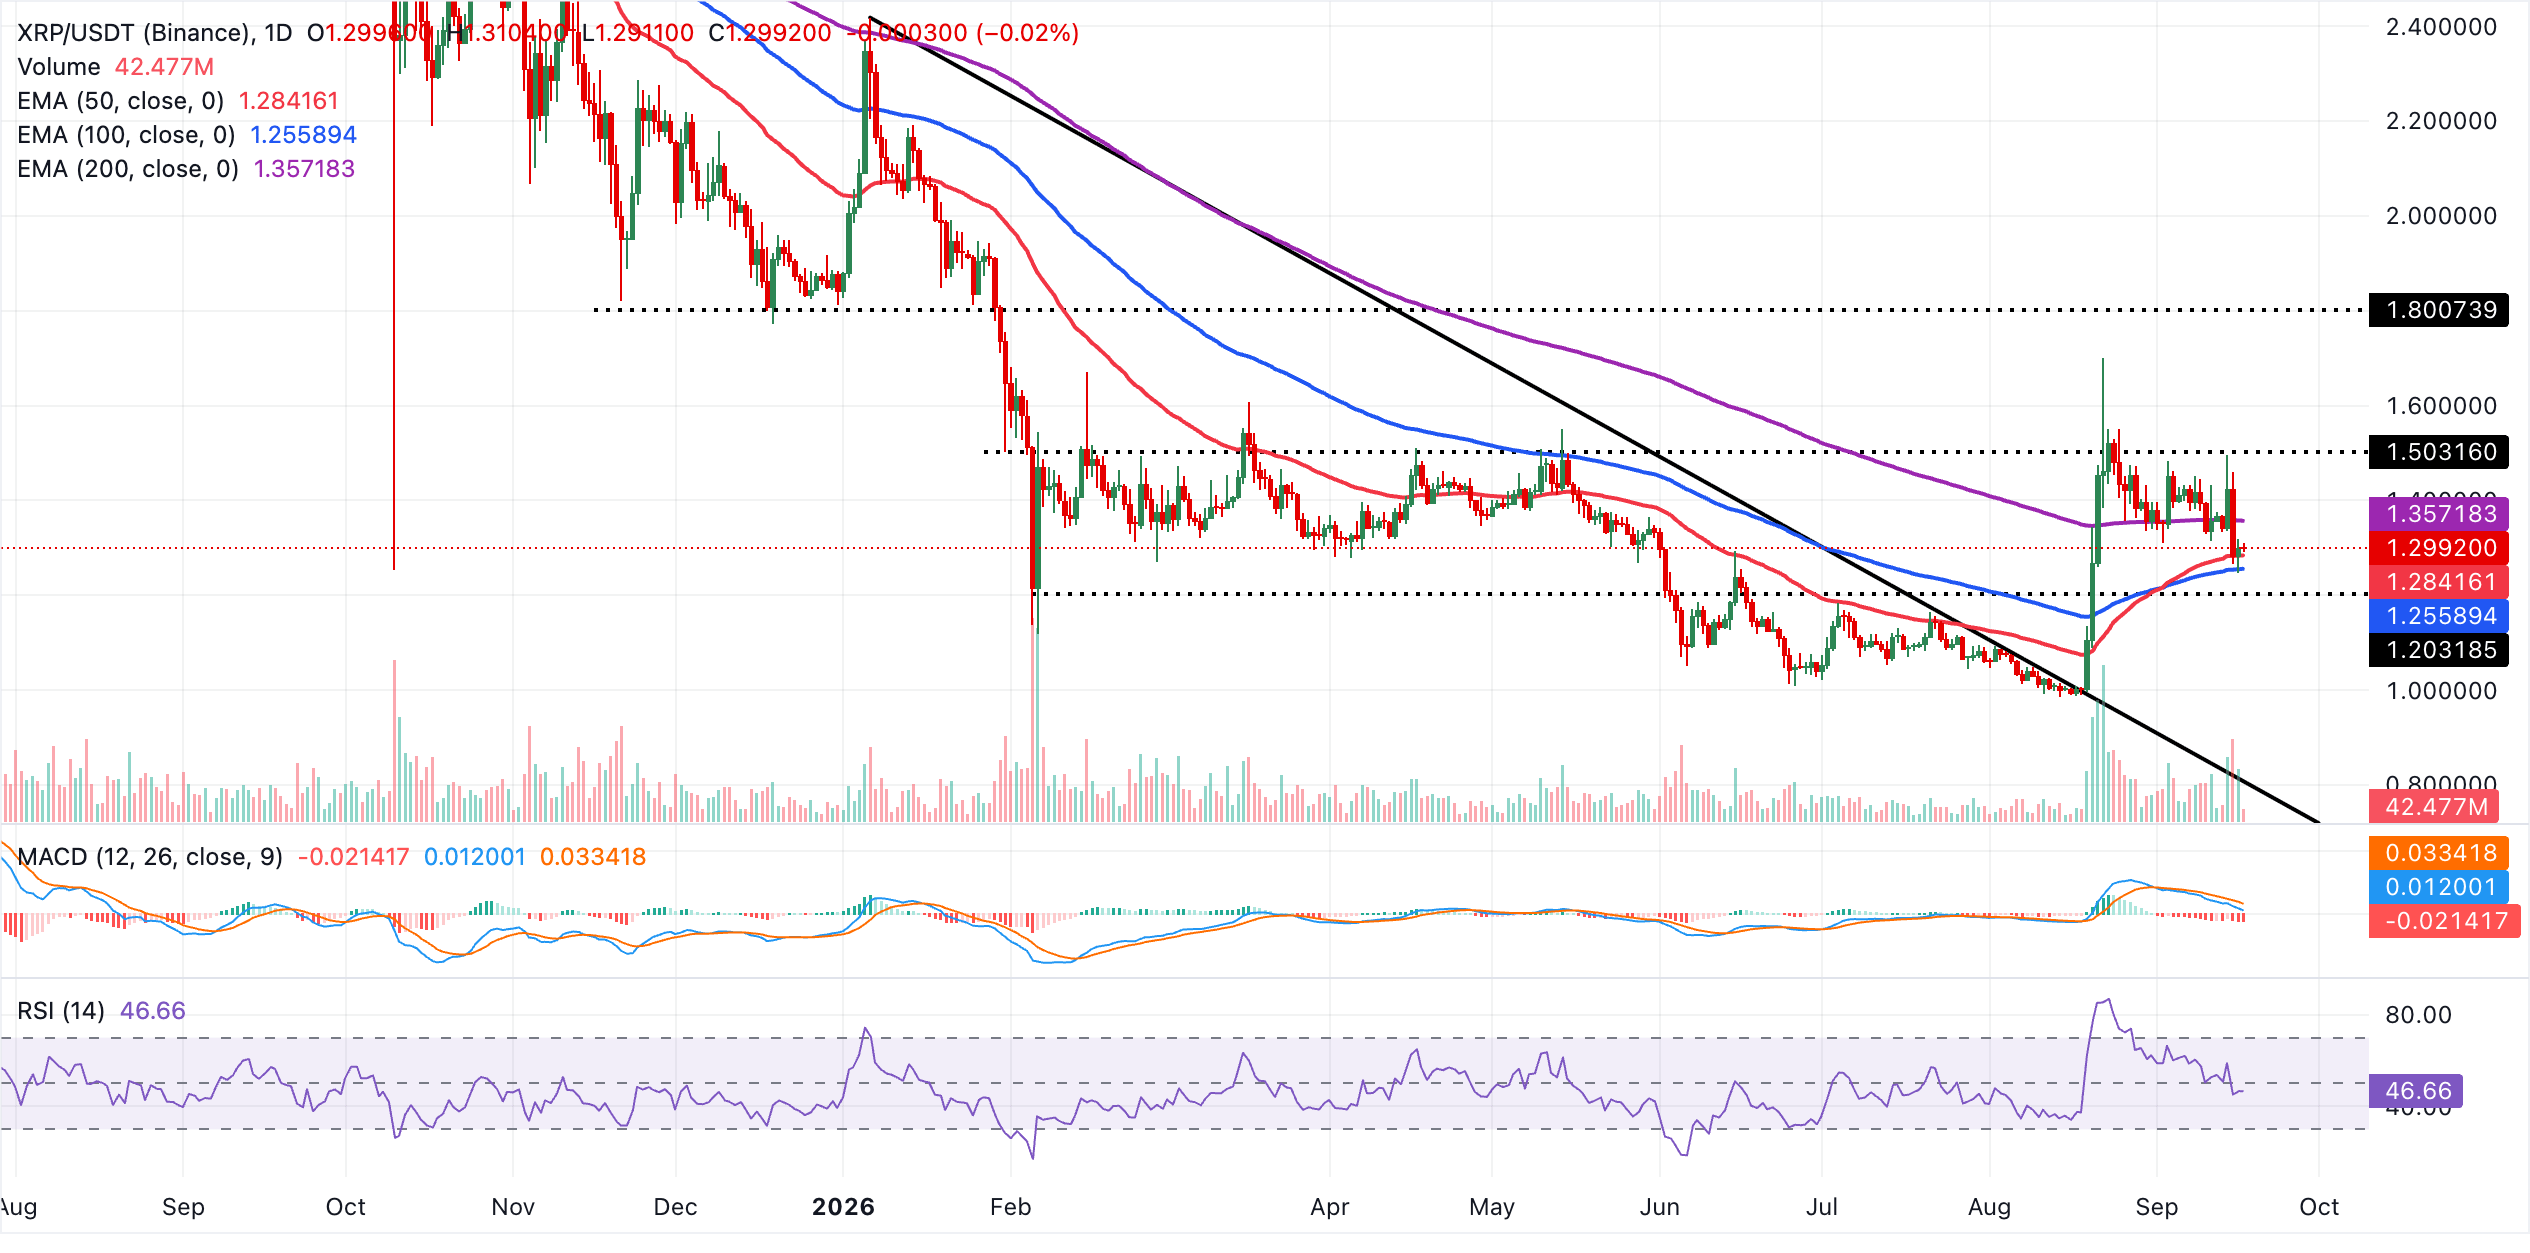
Immediate resistance is defined by the 200-day EMA near $1.36, where sellers are likely to reassert pressure if price extends higher. On the downside, initial support is offered by the 50-day EMA at $1.28, followed by a deeper cushion at the 100-day EMA near $1.26. A daily close below these moving averages would tilt the near-term bias decisively bearish and expose a more pronounced corrective phase.
(The technical analysis of this story was written with the help of an AI tool. Know more.)
Open Interest, funding rate FAQs
Higher Open Interest is associated with higher liquidity and new capital inflow to the market. This is considered the equivalent of increase in efficiency and the ongoing trend continues. When Open Interest decreases, it is considered a sign of liquidation in the market, investors are leaving and the overall demand for an asset is on a decline, fueling a bearish sentiment among investors.
Funding fees bridge the difference between spot prices and prices of futures contracts of an asset by increasing liquidation risks faced by traders. A consistently high and positive funding rate implies there is a bullish sentiment among market participants and there is an expectation of a price hike. A consistently negative funding rate for an asset implies a bearish sentiment, indicating that traders expect the cryptocurrency’s price to fall and a bearish trend reversal is likely to occur.
Recommended Articles


