


Ethereum (ETHUSD) Fluctuated Significantly on Aug 17: Key Variables Behind the Move
Ethereum (ETHUSD) is up 1.01% at Aug 17 00:00(ET), now at $1898.46, with a 7-day up of 1.13%.
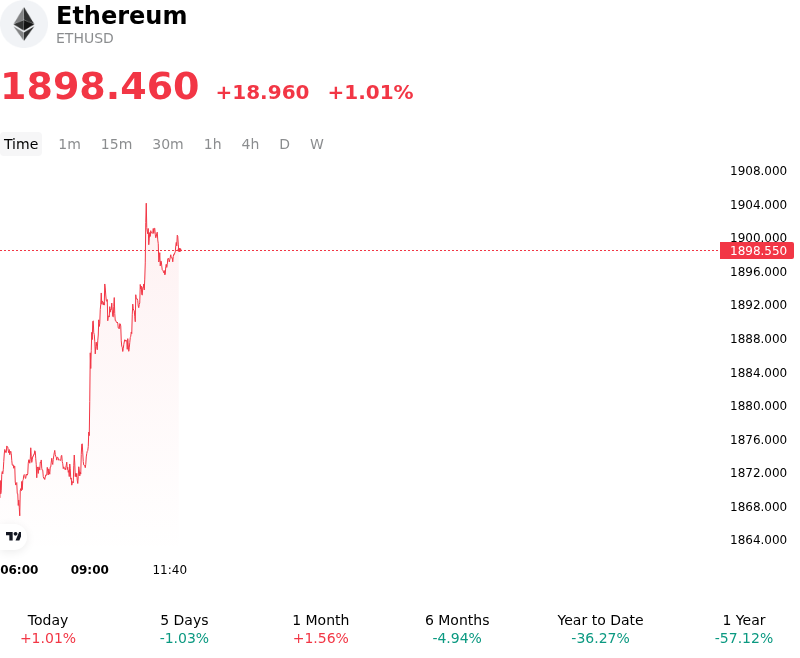
What is driving Ethereum (ETHUSD)’s stock price up today?
Capital allocation into Ethereum reflected renewed institutional engagement, driven primarily by positive spot Ethereum ETF flow dynamics and stabilizing institutional sentiment. Following extended periods of range-bound price action, spot Ethereum investment vehicles recorded notable net inflows across major regulated products. This institutional buying interest signaled that long-term allocators viewed established technical support levels as attractive accumulation zones, effectively absorbing secondary market selling pressure and improving spot market depth.
The broader macroeconomic backdrop provided additional support as market participants recalibrated expectations around Federal Reserve monetary policy and global dollar liquidity. Moderating Treasury yields and mild softness in the U.S. dollar index bolstered demand for risk-sensitive digital assets. Anticipation surrounding upcoming central bank policy communications encouraged constructive positioning across crypto derivatives markets, prompting tactical short-covering near key moving average thresholds and stabilizing liquidity conditions across major centralized exchanges.
On-chain fundamentals and structural ecosystem adoption continued to reinforce long-term valuation metrics. Ethereum maintained its dominant positioning in decentralized finance, supported by sustained expansion in Layer-2 scaling solutions and robust transaction volumes across payment stablecoins. Federal regulatory clarity surrounding stablecoin issuance frameworks has disproportionately benefited Ethereum as the primary settlement layer, steadily constraining liquid exchange balances and driving sustained structural demand for network bandwidth.
From a market structure perspective, the intraday upward trajectory was further amplified by derivatives positioning and leverage dynamics. A modest shift in perpetual swap funding rates across major derivatives venues triggered localized liquidations of heavily leveraged short positions near critical technical pivot zones. While macro uncertainty and broader asset class correlations remain key variables for institutional investors to monitor, the convergence of positive ETF fund flows, expanding Layer-2 utilization, and short-side unwinding provided clear support for Ether.
Technical Analysis of Ethereum (ETHUSD)
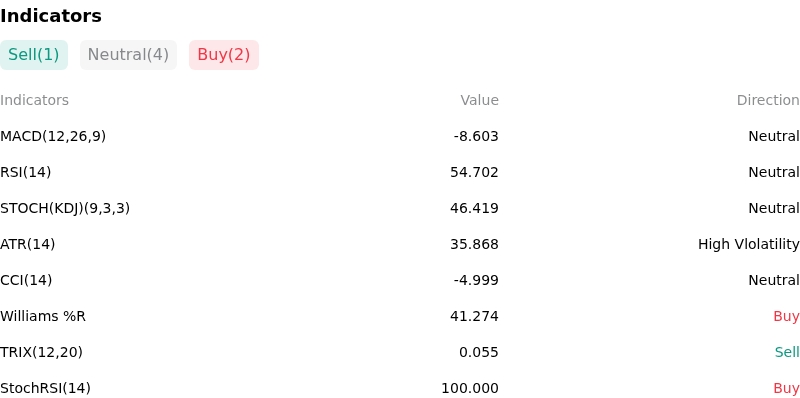
Technically, Ethereum (ETHUSD) shows a MACD (12,26,9) value of -8.603, indicating a neutral signal. The RSI at 54.702 suggests neutral condition and the Williams %R at 41.274 suggests buy condition. Please monitor closely.
More details about Ethereum (ETHUSD)
Recent Events and Risks:
- Technical Support Erosion Below Key Pivot Levels: Repeated rejections above the psychological $1,900 mark have triggered systematic profit-taking, pushing ETH down toward key support near $1,850 and the 50-day Exponential Moving Average. A confirmed breakdown below $1,850 exposes downside liquidation targets down to $1,826 and $1,750.
- Derivatives Shift to Net Market Selling: Ethereum perpetual futures metrics show that Net Taker Volume has flipped negative for the first time in nearly a month, reflecting aggressive market-order selling by short-term traders and increasing vulnerability to cascading long liquidations in nearby order-book clusters.
- Whale Inflows and Overhead Supply Pressure: On-chain tracking shows large-scale wallet transactions moving ETH into centralized exchanges alongside multi-year whale wallet capitulation, indicating persistent spot distribution that creates heavy overhead supply.
- Macro Yield Pressures and Slowing Institutional Momentum: Firm real U.S. Treasury yields and macro policy uncertainty continue to limit broader crypto risk-taking, while a moderating pace of institutional spot ETF buying leaves the market without sufficient demand to absorb ongoing spot and derivative selling pressure.
Recommended Articles


