

Solana Price Forecast: SOL holds above $75 as ETF inflows lift bulls

Source Fxstreet
  • Solana price trades above $75 on Monday after correcting 2.18% last week and finding support at the ascending trendline.
  • US-listed spot ETFs recorded $10.26 million in inflows last week, marking seven straight weeks of positive inflows.
  • The technical outlook remains constructive, with a sustained break above the $78 resistance suggesting further gains.

Solana (SOL) price trades above $75 at the time of writing on Monday after declining 2.18% last week and finding support at an ascending trendline. Continued inflows into spot SOL Exchange Traded Funds (ETFs) suggest sustained investor demand. Meanwhile, the technical outlook remains constructive, with a decisive break above the key $78 mark indicating further gains.

Institutional demand strengthens

Institutional demand for Solana has remained robust. SoSoValue data showed that SOL ETFs recorded an inflow of $10.26 million last week, the highest weekly inflow since May 22 and marking the seventh straight week of positive inflows. If these inflows continue and intensify throughout the week, SOL could extend gains.
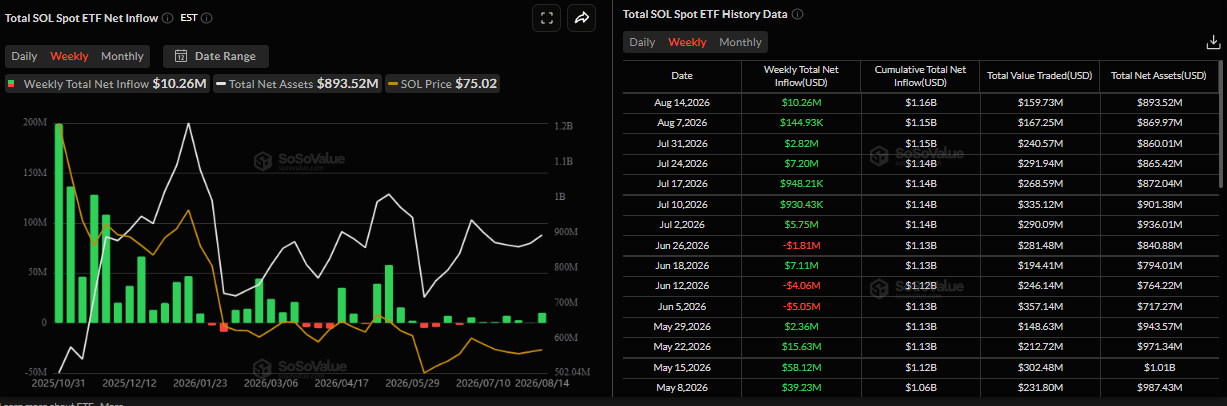
Solana spot ETF net inflow weekly chart. Source: SoSoValue

CryptoQuant’s summary data also shows a mild bullish tilt. SOL’s spot markets show large whale orders and futures markets show cooling conditions, while other metrics remain neutral, supporting a potential recovery.
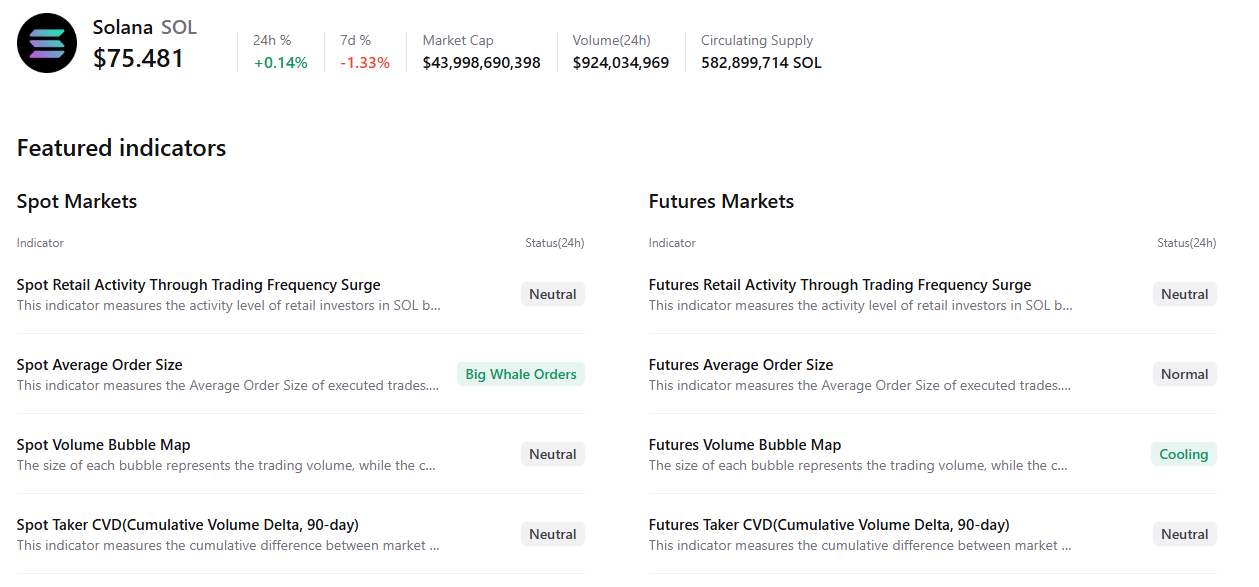
Solana summary data chart. Source: CryptoQuant

Solana Price Forecast: Finds support at the ascending trendline

Solana price trades at $75.53 on Monday, holding marginally above the 50-day Exponential Moving Average (EMA) at $75.48, but remains capped beneath the 100-day EMA at $78.10 and the much higher 200-day EMA at $88.69, keeping the broader tone constrained despite a short-term bounce. 

Momentum is mildly constructive, with the Relative Strength Index (RSI) near a neutral 52 and the Moving Average Convergence Divergence (MACD) holding in positive territory, which hints at stabilizing demand. At the same time, the larger trend structure still argues against a clean bullish breakout.

On the topside, initial resistance is seen at the recent horizontal barrier near $77.07, followed by the 100-day EMA at $78.10; a sustained move above these levels would be needed to ease the current cap and open the way toward the 200-day EMA at $88.69 and the higher resistance zone around $96.19. 

On the downside, immediate support is the 50-day EMA at $75.49, with the rising trendline break area near $73.64 as the next line of defense; a daily close below this level would expose a deeper corrective phase within the prevailing range-bound structure.
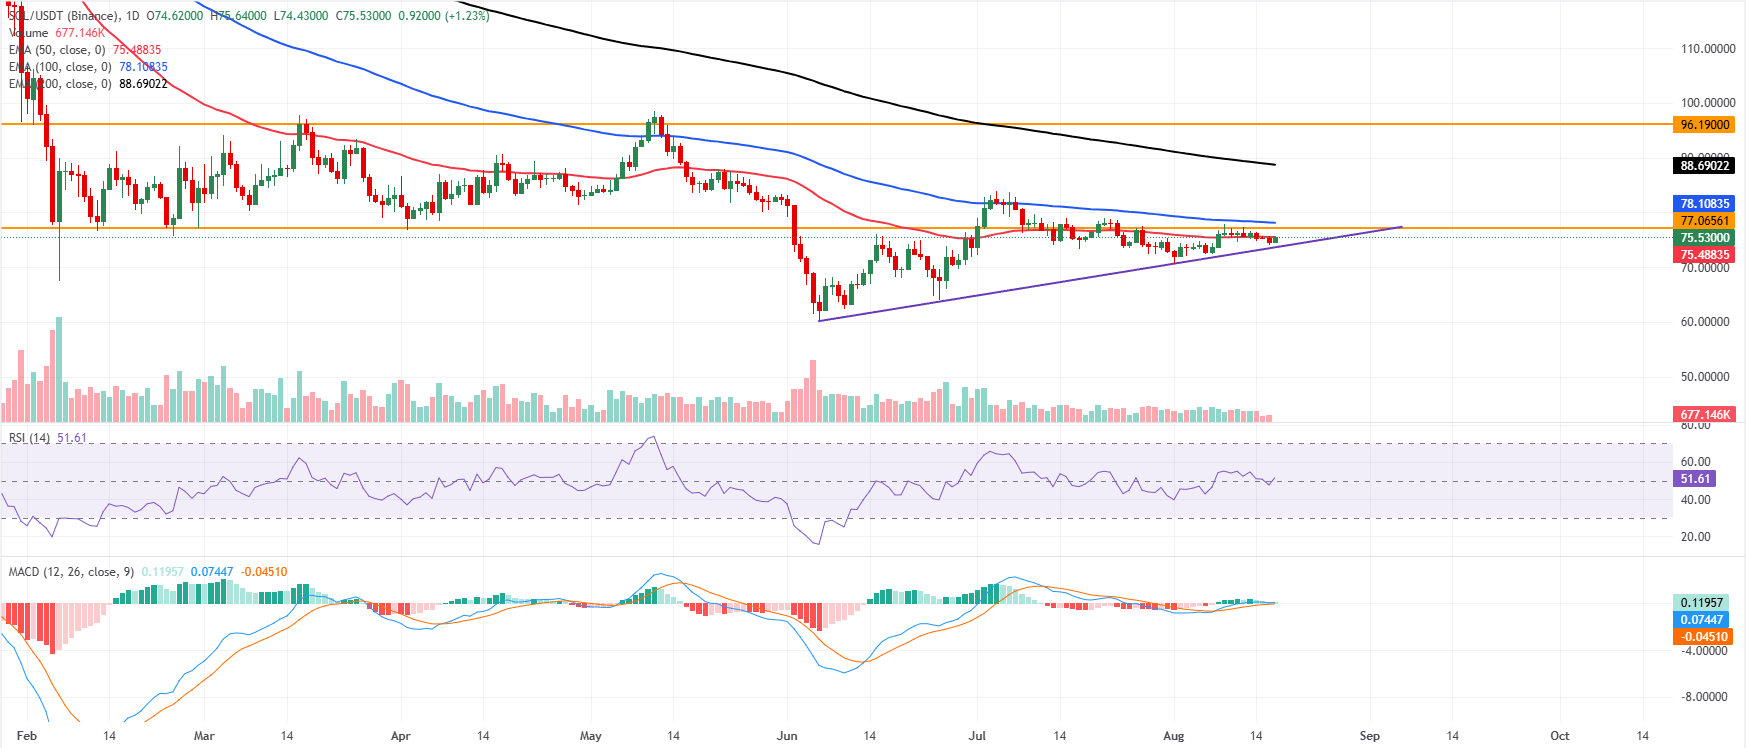
SOL/USDT daily chart

(The technical analysis of this story was written with the help of an AI tool. Know more.)

Disclaimer: For information purposes only. Past performance is not indicative of future results.
placeholder
ECB Policy Outlook for 2026: What It Could Mean for the Euro’s Next MoveWith the ECB likely holding rates steady at 2.15% and the Fed potentially extending cuts into 2026, EUR/USD may test 1.20 if Eurozone growth proves resilient, but weaker growth and an ECB pivot could pull the pair back toward 1.13 and potentially 1.10.
Author  Mitrade
Dec 26, 2025
With the ECB likely holding rates steady at 2.15% and the Fed potentially extending cuts into 2026, EUR/USD may test 1.20 if Eurozone growth proves resilient, but weaker growth and an ECB pivot could pull the pair back toward 1.13 and potentially 1.10.
placeholder
Financial Markets 2026: Volatility Catalysts in Gold, Silver, Oil, and Blue-Chip Stocks—A CFD Trader's OutlookGet a comprehensive financial market 2026 outlook exploring key economic drivers, volatility catalysts in gold, oil and stocks, and what the evolving economic outlook means for cfd trading strategies and risk management on global markets.
Author  Rachel Weiss
May 15, Fri
Get a comprehensive financial market 2026 outlook exploring key economic drivers, volatility catalysts in gold, oil and stocks, and what the evolving economic outlook means for cfd trading strategies and risk management on global markets.
placeholder
Gold Price Forecast: Can Gold Keep Rising After Reclaiming $4,400 as Markets Await Upcoming CPI Data?During Wednesday's Asian trading session, spot gold (XAUUSD) extended its rebound, reclaiming $4,400/oz. As of 11:08 Beijing time on August 12, spot gold was trading at $4,414.705/oz, up
Author  TradingKey
Aug 12, Wed
During Wednesday's Asian trading session, spot gold (XAUUSD) extended its rebound, reclaiming $4,400/oz. As of 11:08 Beijing time on August 12, spot gold was trading at $4,414.705/oz, up
placeholder
WTI declines below $82.50 as oil inventories rise far more than expectedWest Texas Intermediate (WTI), the US crude oil benchmark, is trading around $82.45 during the early Asian trading hours on Thursday. WTI declines on a larger-than-expected build in US crude oil inventories. Traders will closely monitor the developments surrounding US-Iran talks for fresh impetus. 
Author  FXStreet
Aug 13, Thu
West Texas Intermediate (WTI), the US crude oil benchmark, is trading around $82.45 during the early Asian trading hours on Thursday. WTI declines on a larger-than-expected build in US crude oil inventories. Traders will closely monitor the developments surrounding US-Iran talks for fresh impetus. 
placeholder
Gold gains momentum to near $4,400 as Fed hike expectations drop despite Us-Iran tensionsGold price (XAU/USD) gains momentum to around $4,395 during the early Asian trading hours on Monday. The precious metal extends the rally as cooling US inflation data has dampened expectations for the US Federal Reserve (Fed) interest rate hike. 
Author  FXStreet
6 hours ago
Gold price (XAU/USD) gains momentum to around $4,395 during the early Asian trading hours on Monday. The precious metal extends the rally as cooling US inflation data has dampened expectations for the US Federal Reserve (Fed) interest rate hike. 
Related Instrument
goTop
quote