

Toncoin (TON) Price Likely to Bounce Back After Minor Rejection

- Iranian military drones targeted US Fifth Fleet in Bahrain in response to southern US strikes
- Gold plummets below $4,200 as US‑Iran tensions spur hawkish rate bets ahead of US CPI
- Gold Price Trend Forecast: US-Iran Peace Talks Drive Gold Rebound, Is the Gold Slump Over?
- SpaceX Listing Imminent. Funds Flood Into SpaceX On-Chain Tokens, Bitcoin Rebound Momentum May Be Weakened
- US May CPI Preview: Rising Inflation May Push Up Fed Rate Hike Expectations, How Will US Stocks, Dollar, Gold React?
- Gold Drops Below $4,300 Erasing Year-to-Date Gains. This Week’s CPI May Ignite Rate Hike Expectations Will Gold Still Rise in 2026?

Toncoin’s (TON) recent attempt to hit $6 was met with a brief setback. The price declined as soon as it hit $5.55. As of this writing, TON sits at $5.20.
Despite the minor retracement, several indicators suggest that the cryptocurrency might soon continue to swing higher.
Toncoin Gets Support from Key Indicators
One key indicator supporting the forecast is the On Balance Volume (OBV), which uses trading volume to predict price movements. On the daily Toncoin chart, the OBV has spiked.
When the OBV declines, it signals higher selling volume compared to buying, indicating increased selling pressure that could push the price down. However, for TON, the rising OBV shows that more tokens are being bought than sold. If this trend persists, the token’s price could resume its previous uptrend.
Read more: What Are Telegram Bot Coins?
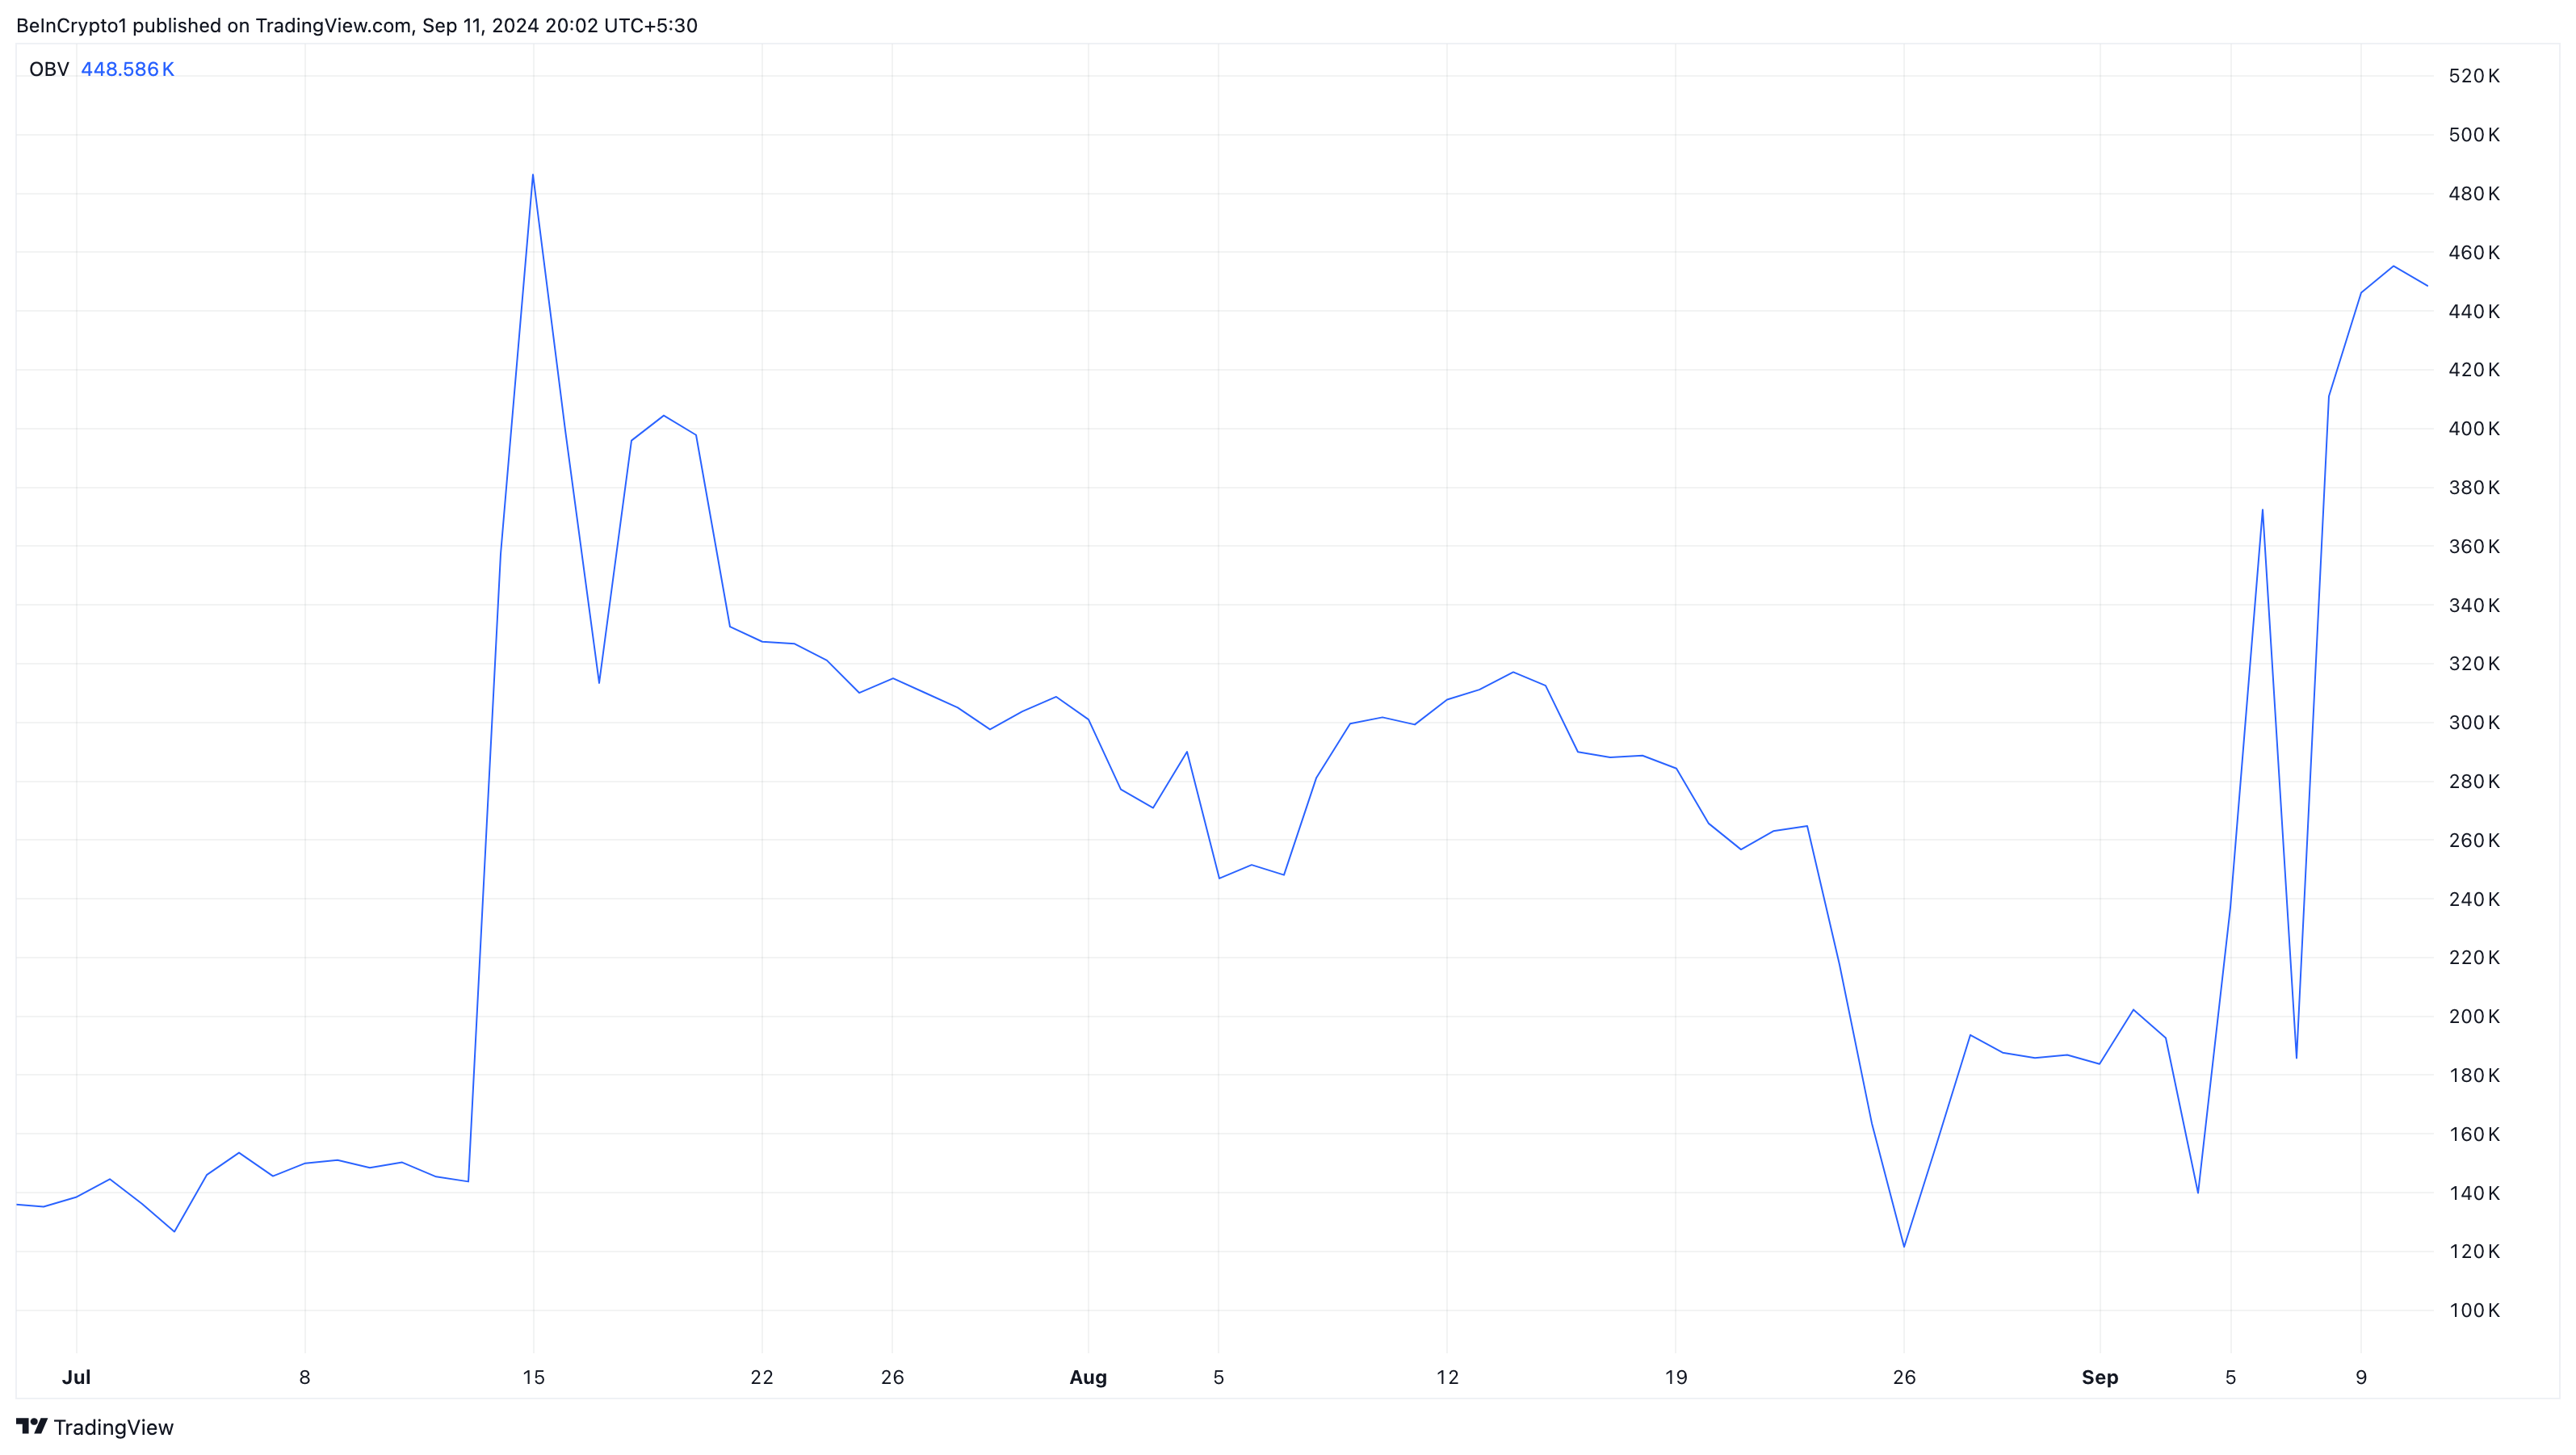 Toncoin On Balance Volume. Source: TradingView
Interestingly, crypto analyst TheMoonCarl also agrees with the bias. In a post shared on X, he showed that Toncoin’s price has formed a double bottom pattern.
A double-bottom pattern indicates that sellers are losing momentum, and a reversal from a downtrend to an uptrend could be likely. Therefore, based on TheMoonCarl’s analysis, the token might surpass $6 once it breaks above the falling trendline.
“TON is trying to break the Descending Resistance after forming a local double-bottom exactly in the support area,” the analyst said.
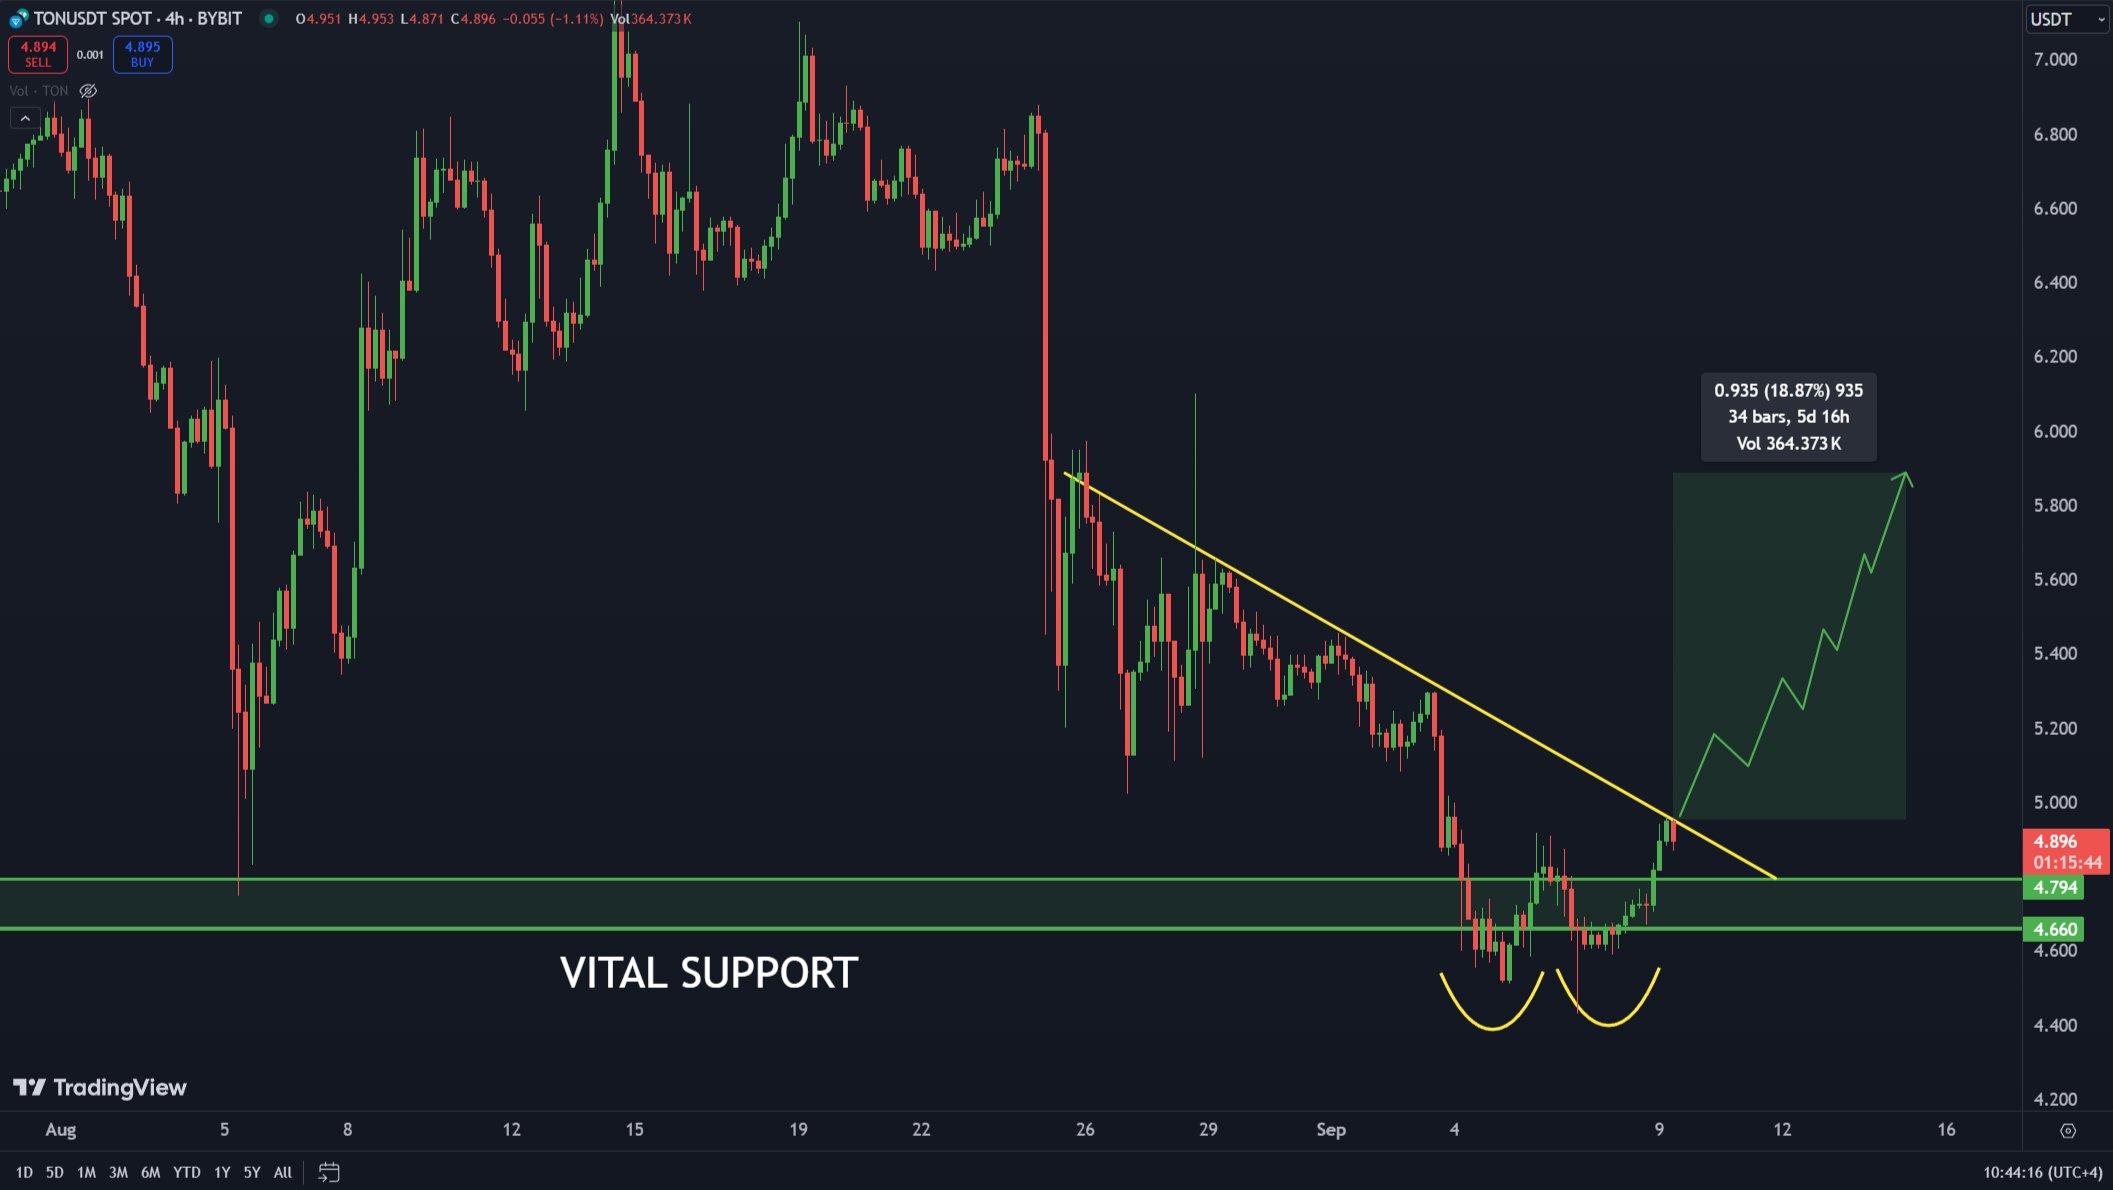 Toncoin 4-Hour Analysis. Source: X/Twitter
TON Price Prediction: $7 Is Within Reach
On the daily chart, Toncoin shows a solid support zone around $4.95, suggesting it may avoid another significant correction. This position might help TON resist falling below $5.
The green histogram bars displayed by the Awesome Oscillator (AO) support this outlook, as the AO measures momentum and price trends by comparing short- and long-term moving averages. Although the current AO reading is negative, indicating a bearish trend, the green bars suggest that the decline might be short-lived.
Read more: 10 Best Altcoin Exchanges In 2024
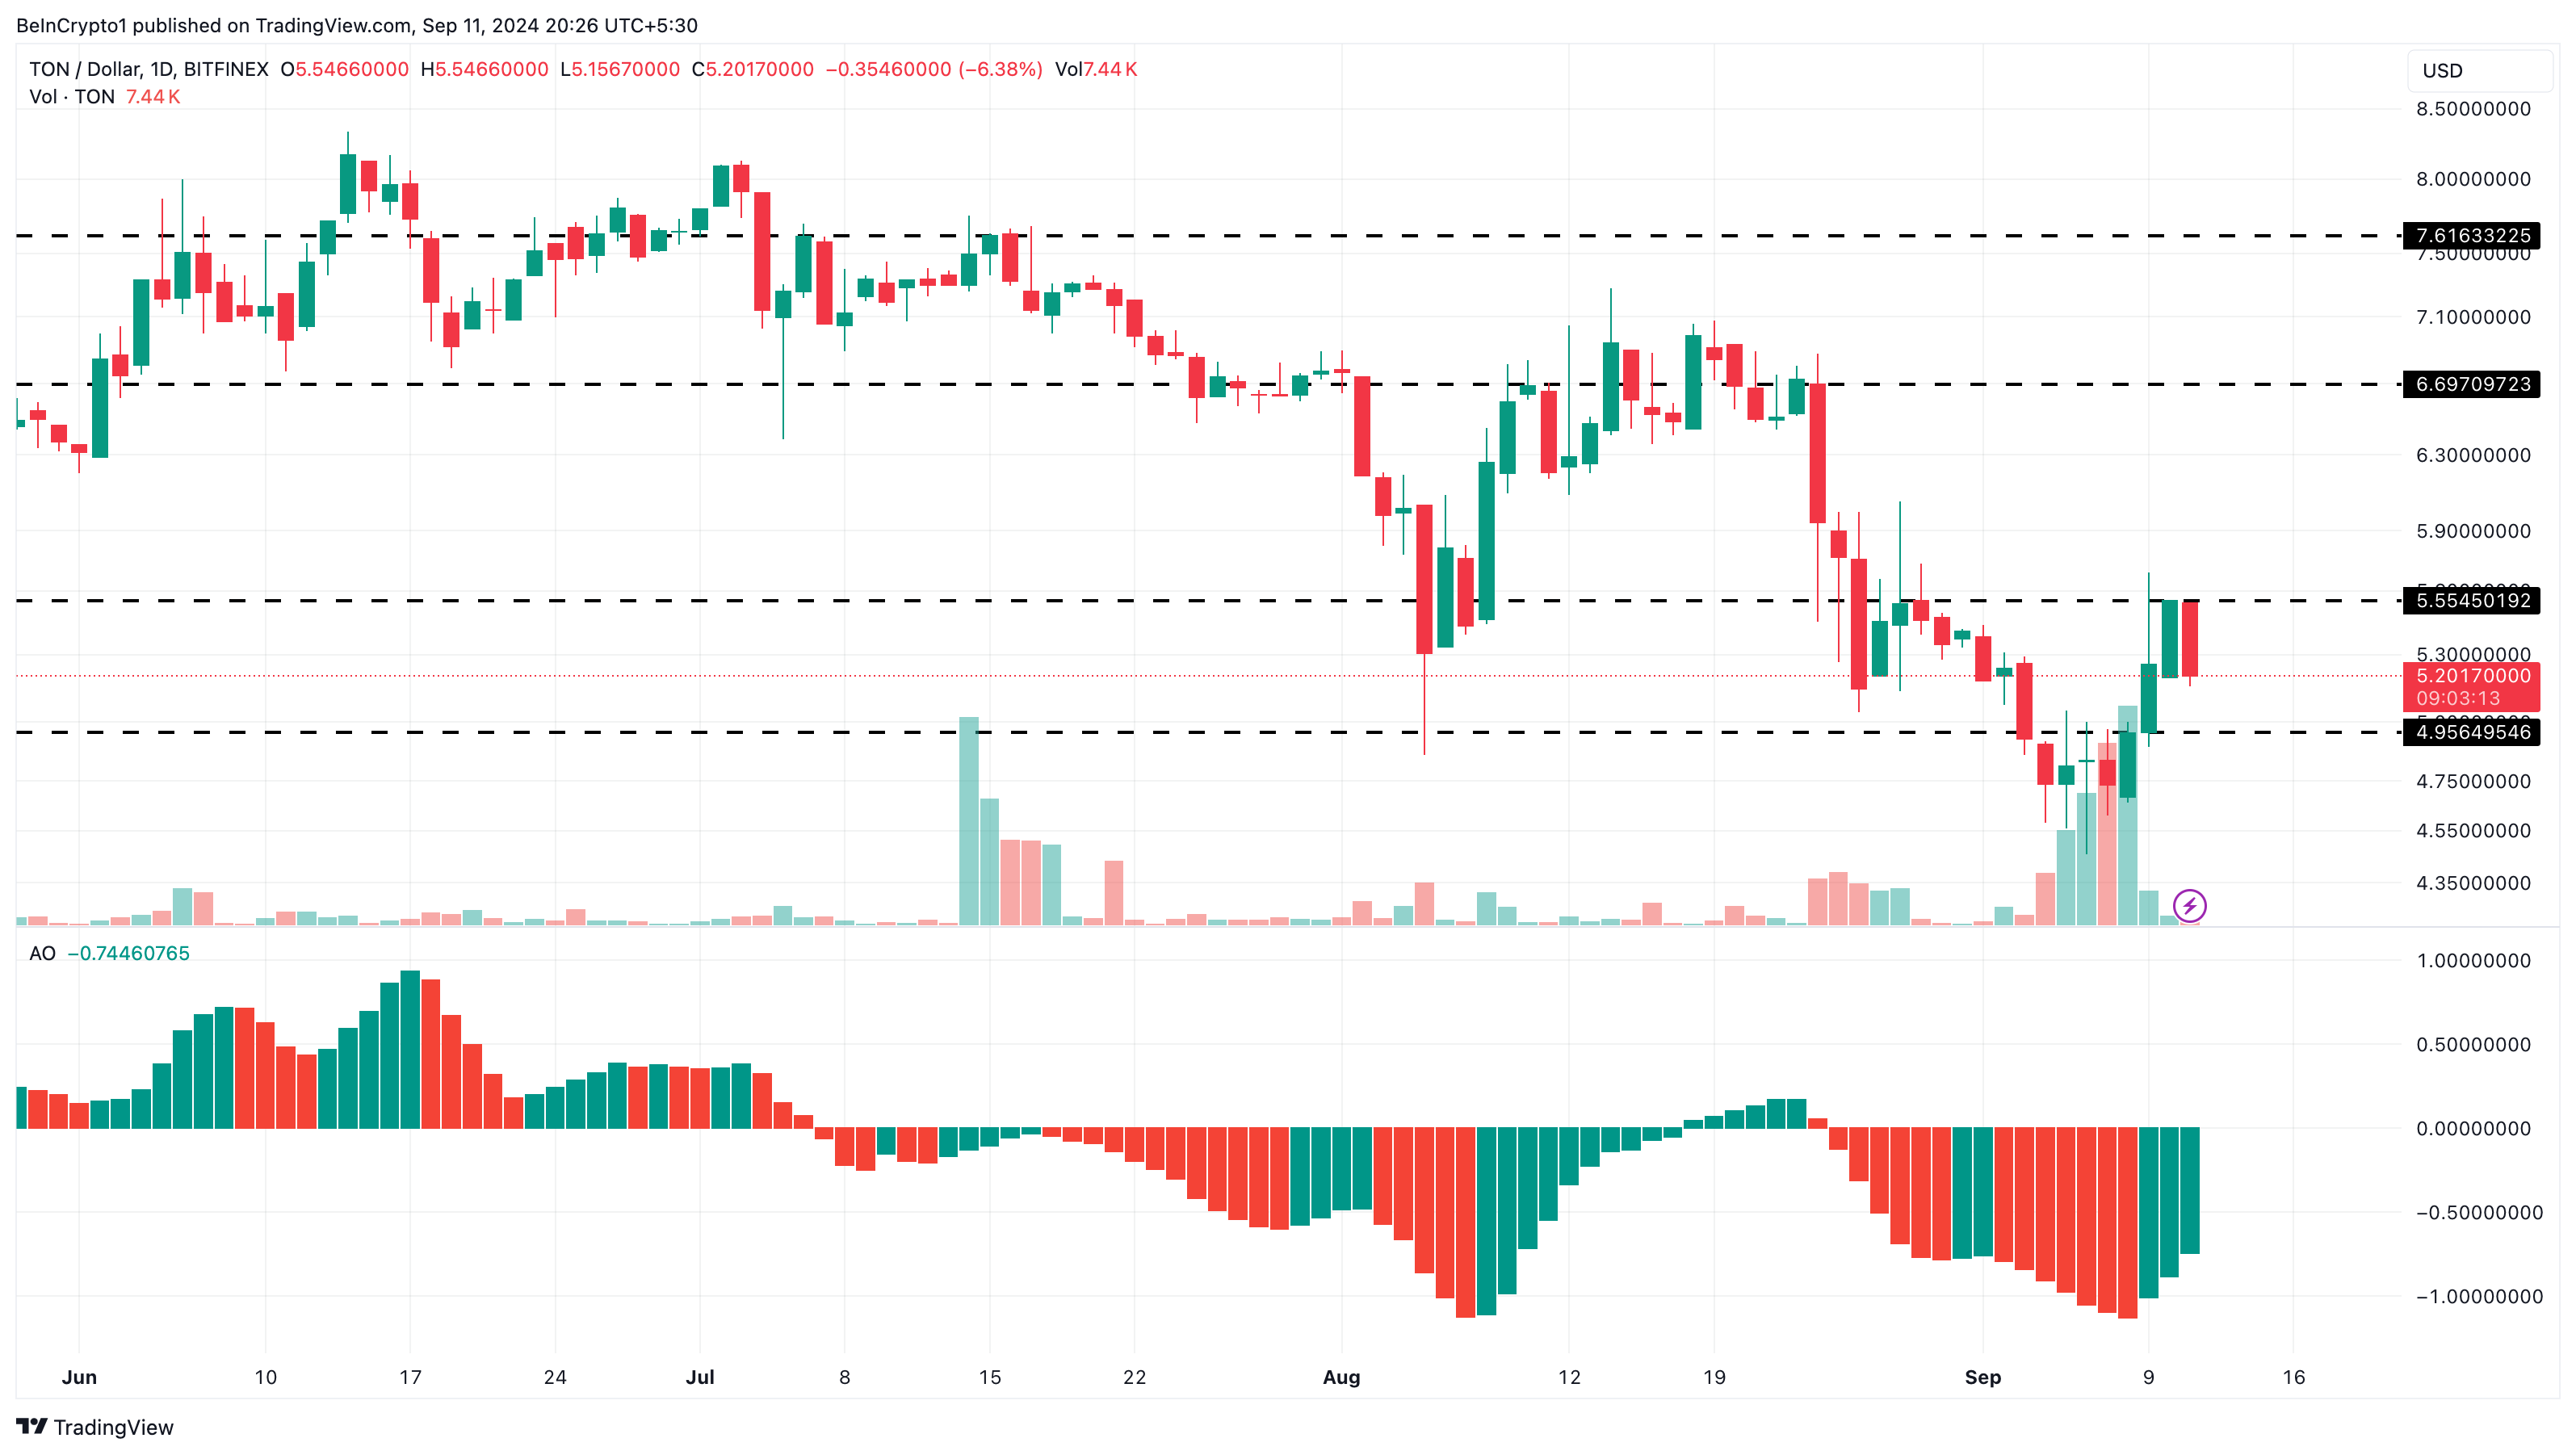 Toncoin Daily Analysis. Source: TradingView
As a result, TON’s price could see a quick bounce, potentially targeting $6.69. In highly bullish conditions, it might even reach $7.61. However, if TON slips below $5, it could drop further, possibly below $4.95.
Read more
* The content presented above, whether from a third party or not, is considered as general advice only. This article should not be construed as containing investment advice, investment recommendations, an offer of or solicitation for any transactions in financial instruments.


