

Official Trump Price Forecast: TRUMP extends rally as whale activity and bullish momentum strengthen

- Gold Price Trend Forecast: Why Did Gold Prices Fall After US CPI Cooled? Fed Chair Speech and Iran Situation Become Obstacles
- Gold Price Trend Forecast: June CPI Plus Fed Chair Congressional Testimony, Can Gold Price Hold Above $4,000?
- TradingKey Daily Market Brief: Gold Falls Below $4,000, TSMC’s Strong Earnings Fail to Stop AI Trade Cooling, Chip Stocks Sold Off
- Gold Price Forecast: Cooling Inflation Fails to Offset Fed Hawkish Pressure, Gold Price May Fall to $3,500
- Tesla Q2 Earnings Preview: Record Deliveries Fail to Hide Profit Pressure, Can Musk Rely on AI and Autonomous Driving to Unlock New Growth Space?
- Today’s Market Recap: Unexpected PPI Drop Boosts Markets, Apple Hits All-Time High, AI Hardware Stocks Remain Under Pressure, Micron, SanDisk Slump
Official Trump price extends its gains on Thursday after rallying more than 16% the previous day.
On-chain and derivatives data suggest a bullish outlook with rising whale activity, improving buy dominance, and positive funding rates.
Technical indicators show strengthening bullish momentum, signaling potential for continued upside.
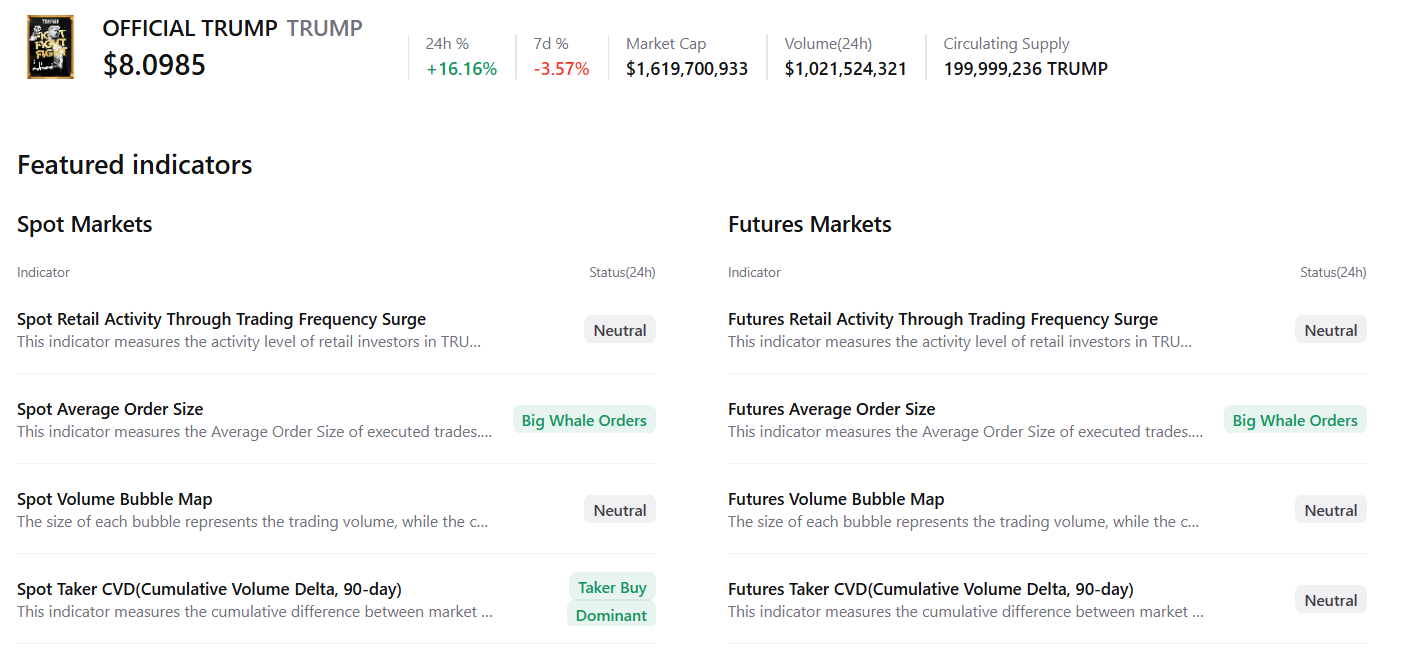
Official Trump (TRUMP) price continues its upward trajectory, trading above $8.32 at the time of writing on Thursday, building on a 16% rally from the previous day. On-chain and derivatives data paint a bullish picture as whale accumulation, buy dominance, and positive funding rates strengthen investor confidence. Meanwhile, momentum indicators suggest that TRUMP’s bullish run could extend further in the upcoming days.
TRUMP’s on-chain and derivatives data show a bullish bias
CryptoQuant’s summary data supports the positive outlook, as TRUMP’s spot and futures markets show large whale orders and buy dominance, signaling a potential rally ahead.
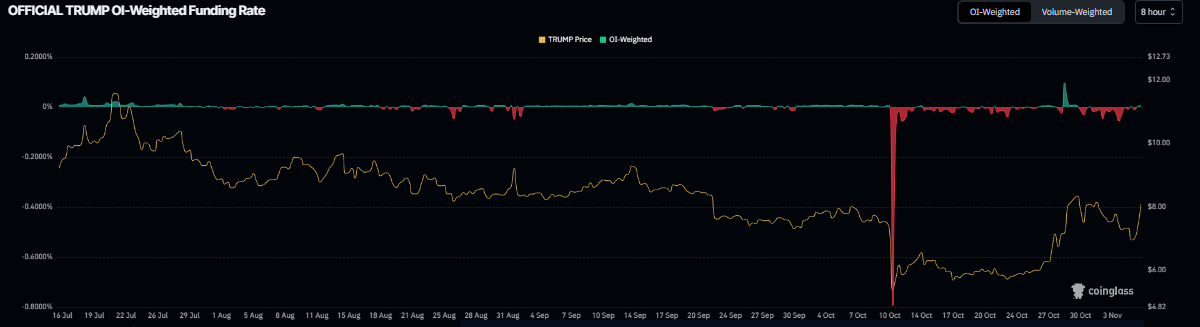
Derivatives data also support a bullish bias. Coinglass’s OI-Weighted Funding Rate data shows that the number of traders betting that the price of TRUMP memecoin will slide further is lower than those anticipating a price increase.
The metric has flipped to a positive rate, standing at 0.0053% on Thursday, indicating that longs are paying shorts. Historically, as shown in the chart below, when the funding rates have flipped from negative to positive, Official Trump’s price has rallied sharply.
Official Trump Price Forecast: TRUMP bulls aiming for $11.92 mark
Official Trump price found support around the 50-day Exponential Moving Average (EMA) at $7.30 on Tuesday and rose more than 16% on the next day. At the time of writing on Thursday, TRUMP is trading higher around $8.31, breaking above the descending trendline.
If TRUMP closes above the 61.8% Fibonacci retracement level at $7.95 on a daily basis, it could extend the rally toward the July 21 high of $11.92.
The Relative Strength Index (RSI) on the daily chart reads 61, above the neutral level of 50, indicating bullish momentum gaining traction. Additionally, the Moving Average Convergence Divergence (MACD) indicators showed a bullish crossover that remains intact, indicating the continuation of an upward trend.
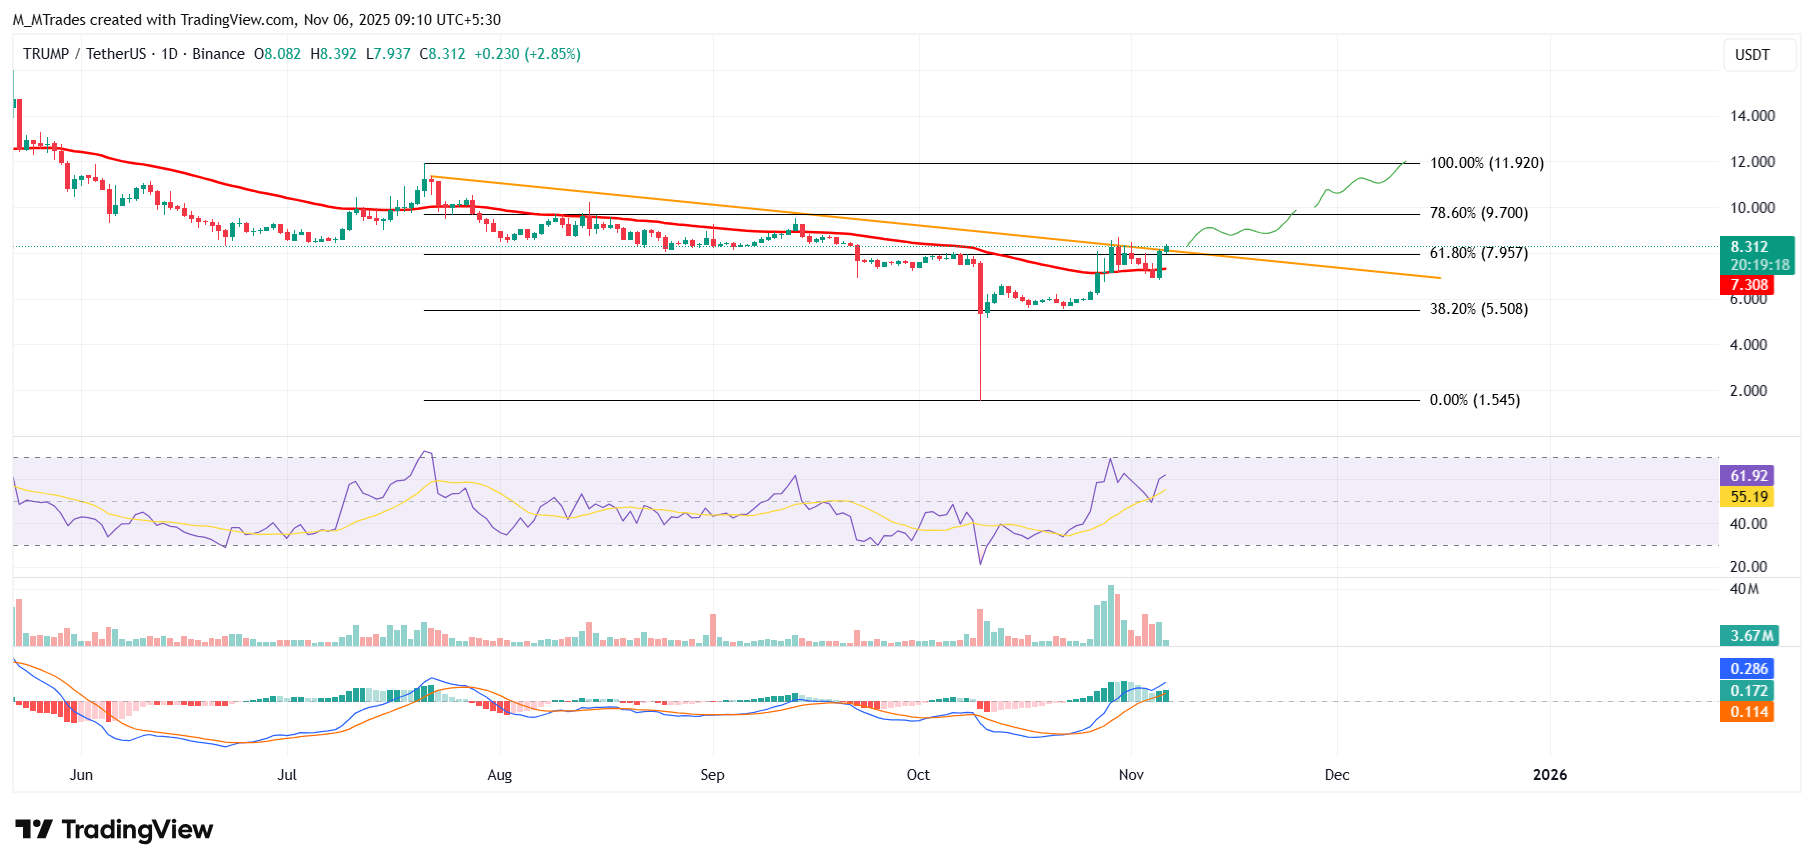
On the other hand, if TRUMP faces a correction, it could extend the decline toward the 50-day EMA at $7.30.
Read more
* The content presented above, whether from a third party or not, is considered as general advice only. This article should not be construed as containing investment advice, investment recommendations, an offer of or solicitation for any transactions in financial instruments.


