


Brent holds above $100 as tanker attacks tighten supply — but four forces are capping the rally

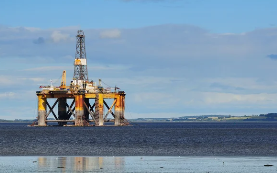
Brent crude is holding above $100 a barrel for a second session — its first close above the round number since late July — as attacks on shipping near the Strait of Hormuz tighten an already strained physical market. The global benchmark was last at $100.40, giving back part of Wednesday's gain, while WTI traded around $95.5. Over the past month Brent has risen 12.9% and it is up 51% over the year.
Yet the move has been strikingly orderly for a market that has lost a fifth of the world's seaborne crude artery. Here is what is driving the price, and the four forces preventing it from going much higher.
The milestone: Brent's first close above $100 since late July
Brent settled at $101.21 on Wednesday 9 September, the first close above $100 since 24 July. Since the low point in early August, the benchmark has added nearly 30%. The trigger was a fresh escalation in the six-month-old US-Iran conflict that has become the largest shipping confrontation of the war so far: Iran said it attacked 10 vessels near the Strait of Hormuz, after the US sank five Iranian tankers, and said it would escalate further in response to any new strikes.
Physical benchmarks moved further and faster than futures. Dated Brent has held above $100 continuously since 3 September, Dubai and Oman cargoes for November loading are trading at premiums of more than $20 a barrel over Dubai quotes — back to April levels — and Oman futures touched $121.68 on Wednesday.
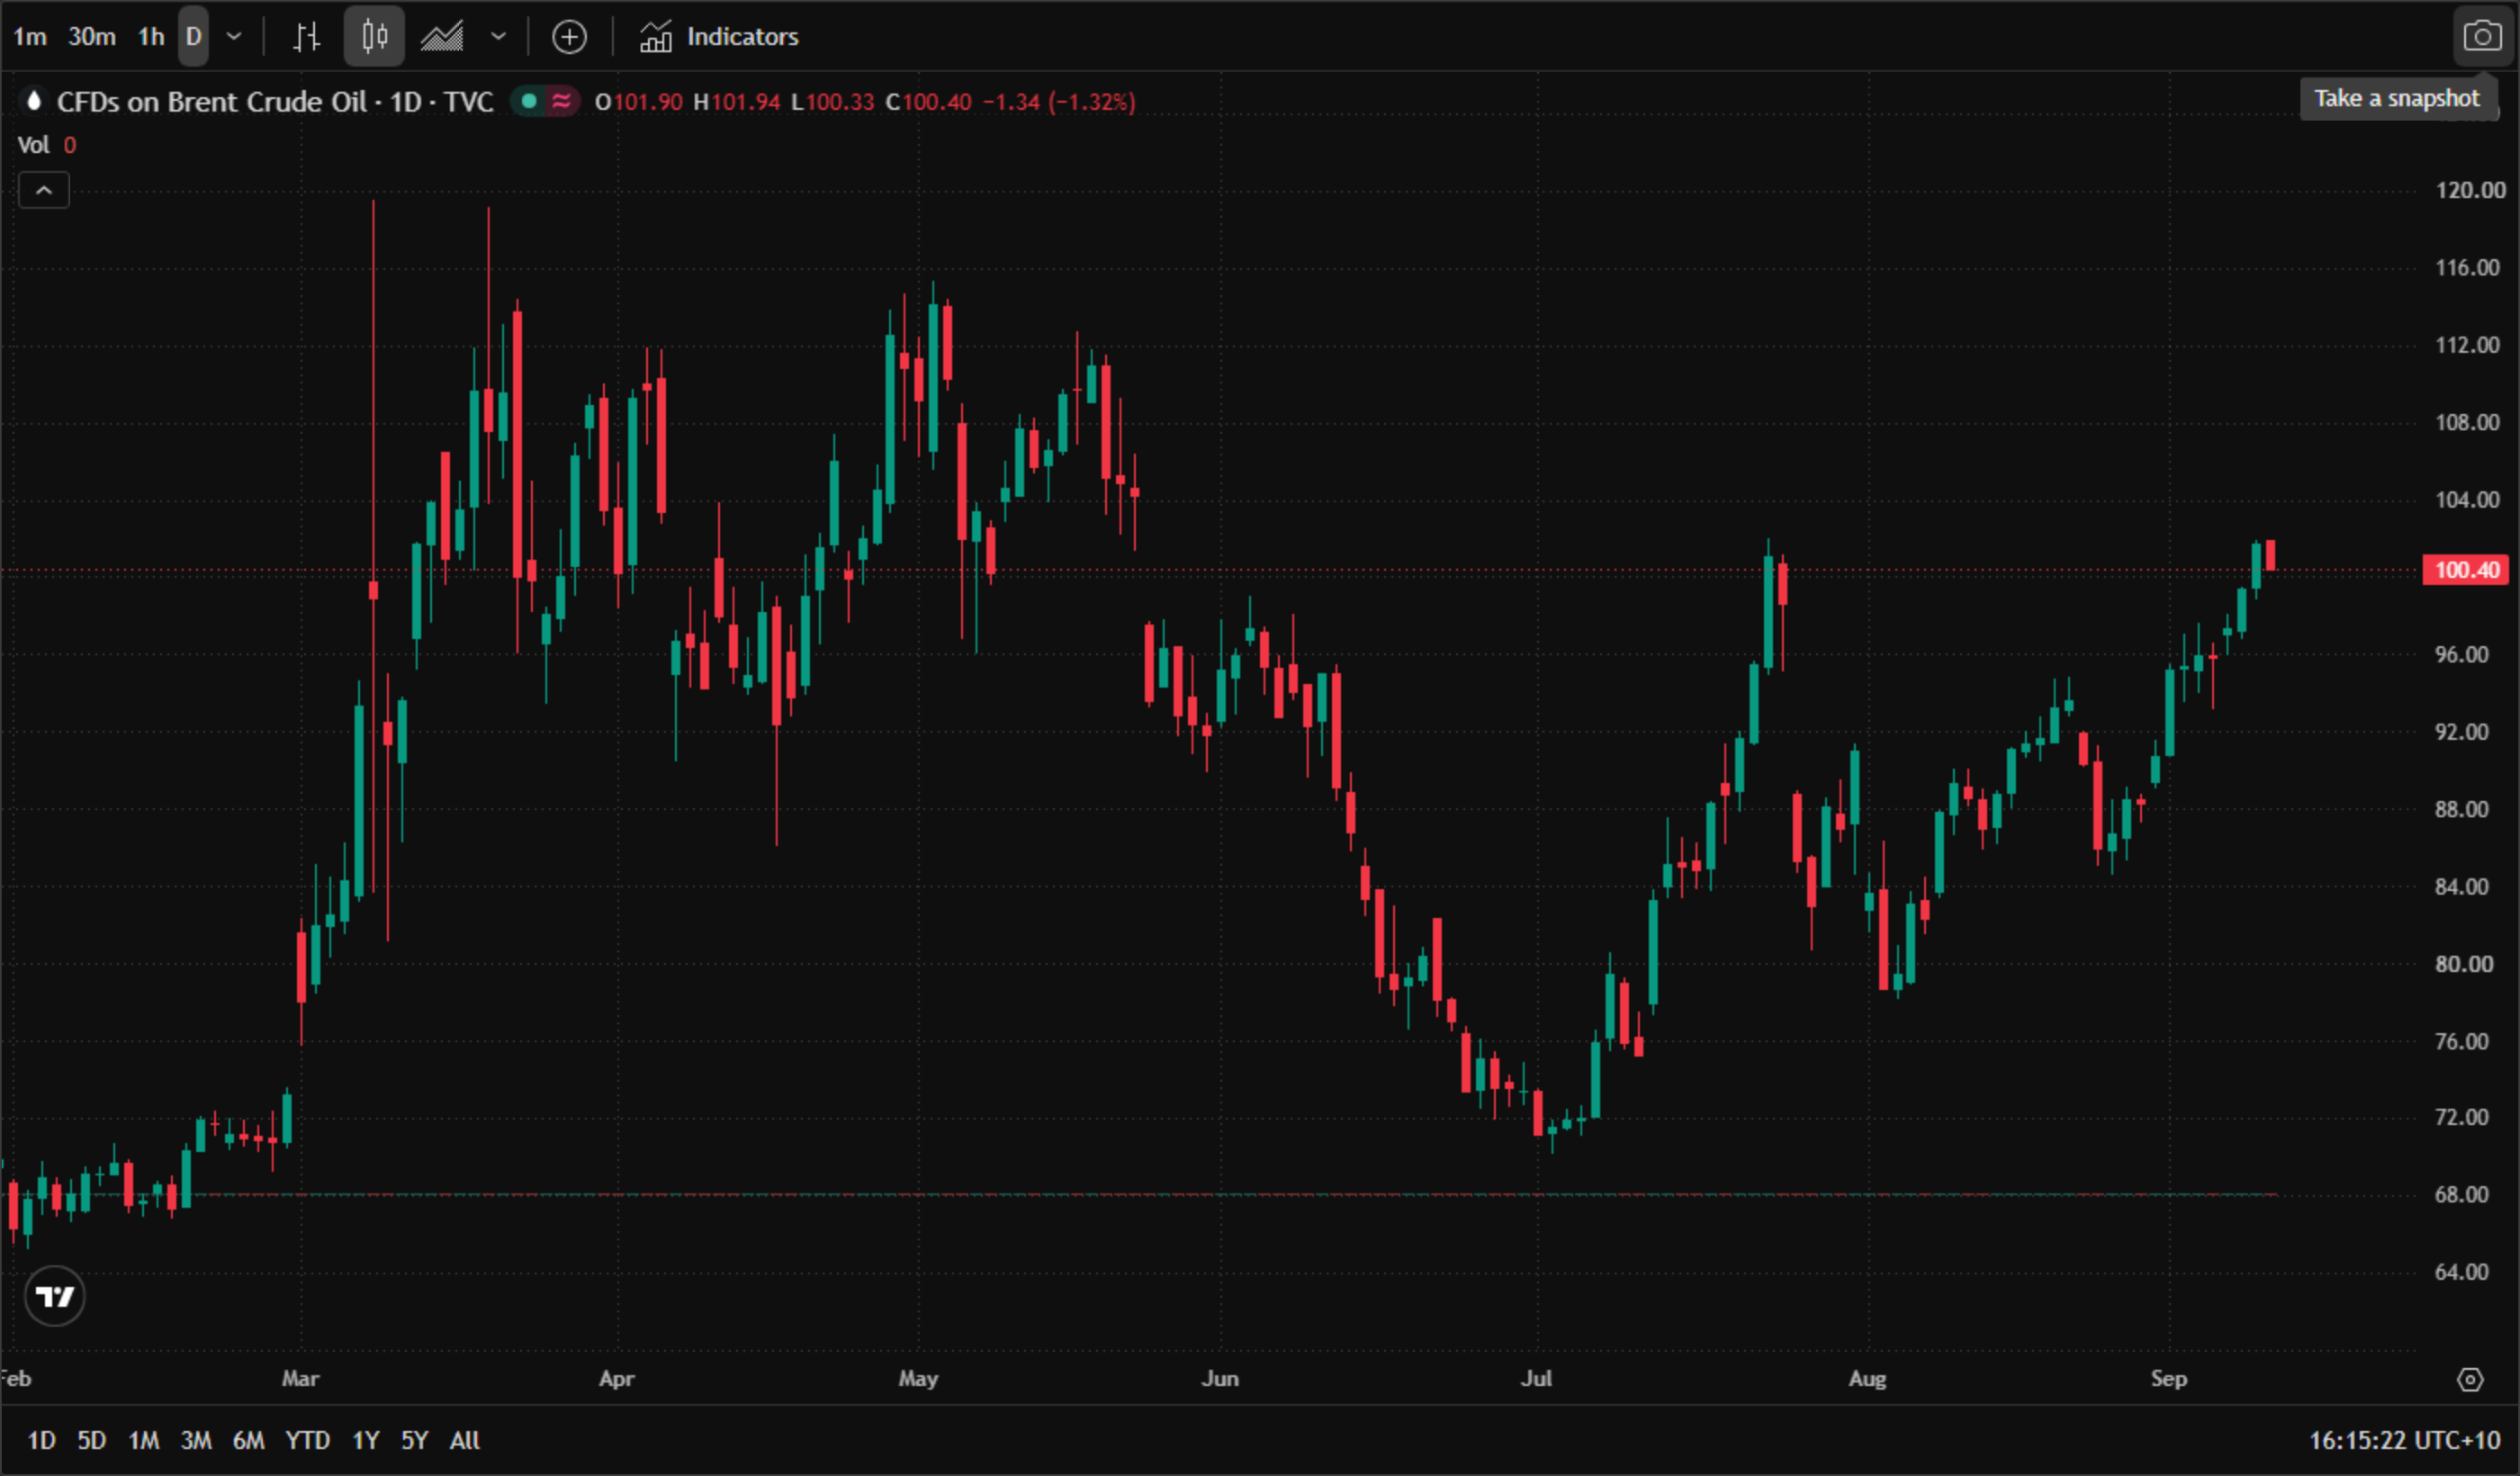
* Chart source: official TradingView chart screenshot, TVC data feed (CFDs on Brent Crude Oil), captured 10 September 2026 at 4:15 pm AEST. Cross-checked against Yahoo Finance front-month Brent futures (September 9 settlement: $101.21).
Supply: 8.3 million barrels a day is still shut in
The supply side is the core of the story. Hormuz shipping traffic has fallen to single digits, according to vessel-tracking data, against a waterway that normally carries about a fifth of global oil and gas. The IEA's August Oil Market Report estimates 8.3 million barrels a day (mb/d) of Gulf output remains shut in, and now expects global oil supply to fall by 4.3 mb/d on average in 2026 before rebounding by 8.3 mb/d to 110.3 mb/d in 2027.
The EIA's latest Short-Term Energy Outlook, published on 9 September, assumes shut-in volumes average 5.7 mb/d in the fourth quarter and estimates global inventories drew down by 3.9 mb/d in the second quarter, with further draws of 3.0 mb/d in the third quarter and 1.7 mb/d in the fourth. US distillate stocks are expected to fall below 100 million barrels in September — a level that has historically coincided with sharp product-price spikes.
Vitol chief executive Russell Hardy told Singapore's APPEC conference that roughly 9 mb/d of crude and 1 mb/d of refined products have been exported from the Middle East in recent days, against roughly 20 mb/d of crude and products before the conflict began on 28 February.
Why isn't oil even higher?
Four forces have kept a lid on the rally.
Barrels are still getting out. In the week before fighting resumed on 30 August, 8 to 9 mb/d was still flowing through Hormuz — double the previous week — and during the July interim agreement flows briefly returned to pre-war levels near 16 mb/d.
Alternative routes are absorbing volume. Saudi Aramco resumed loadings from Ras Tanura inside the Gulf in August; Egypt's Sidi Kerir terminal on the Mediterranean shipped 2.139 mb/d in August, more than double June volumes; Iraqi exports rebounded to about 2.34 mb/d; UAE shipments held near 2.9 mb/d; and Kuwaiti exports recovered to roughly 1 mb/d.
Non-OPEC producers are filling part of the gap. US, Canadian and Guyanese output is set to rise by a combined 1.4 mb/d this year, according to Rystad Energy. Russian crude exports held near 5.5 mb/d in July and August — still 23% above February levels, as refinery damage from Ukrainian strikes pushed more crude into export channels.
Demand destruction is doing the rest. The IEA now forecasts world oil demand will fall by 1.6 mb/d in 2026 — 510 kb/d more than its previous estimate — with the annual contraction easing from 4.9 mb/d in the second quarter to 2.8 mb/d in the third before returning to growth in the final quarter; demand is then projected to expand 2.4 mb/d in 2027. China, described by traders as the "new demand OPEC", has cut seaborne crude imports to 7 mb/d from more than 11 mb/d in February, and Sinopec's research arm expects Chinese oil demand to fall 600 kb/d, or 8.9%, in 2026 — a third straight annual decline. Beijing's reserves, estimated by Kpler at 1.17 billion barrels, have also cushioned the market.
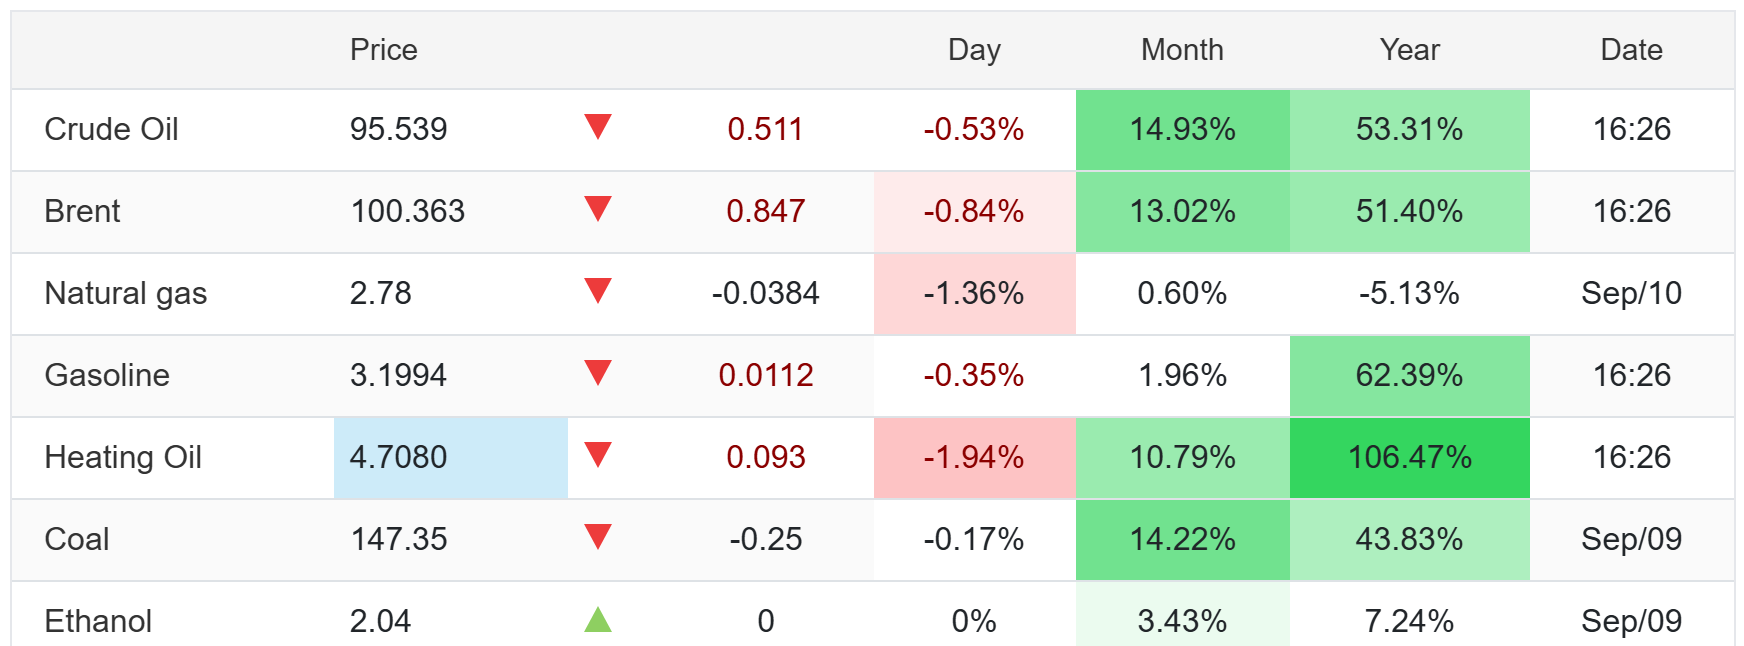
* Source: Trading Economics energy commodity price table (tradingeconomics.com/commodity/brent-crude-oil), captured 10 September 2026.
The physical market is telling a different story
Product markets, not headline crude, are where the shortage is most visible.
"At the moment, it's telling us that physically things are incredibly tight," said David Fyfe, chief economist at Argus. "We've already got prices substantially above $100 a barrel and even more important, you've got a diesel market that is screaming shortage."
US retail diesel hit a record $5.820 a gallon in early September, and the IEA notes that tighter light and middle distillate markets have pushed Atlantic Basin refining margins to record highs. It is this product tightness — rather than crude alone — that is now feeding through into headline inflation.
Forecasts are colliding: $74 to $100
The gap between the bulls and the bears is unusually wide for a single commodity:
| Institution | Brent forecast | Horizon |
|---|---|---|
| Morgan Stanley | $100 | Q4 2026 average |
| EIA (STEO, 9 Sep) | $90 (raised $8); 2026 average $91 | 2H 2026 |
| HSBC | $90 → $85 | 2026 → 2027 |
| Goldman Sachs | $85 Brent / $80 WTI | Dec 2026 |
| EIA (STEO, 9 Sep) | $74 (Brent) | 2027 average |
Goldman raised both its Brent and WTI forecasts by $5 a barrel for December 2026 and 2027, citing an expectation that Middle East shipping disruptions will persist into next year — yet its numbers still sit well below the spot price, a signal that the market expects normalisation rather than a permanent repricing. The EIA sees most production and trade flows only returning to pre-conflict levels in the second quarter of 2027.
Two more institutional updates land this week and next: OPEC's Monthly Oil Market Report is due today (10 September), and the IEA's September Oil Market Report follows mid-month.
Levels to watch
| Support | Resistance |
|---|---|
| $100.00 (round number; the pivot of the last two sessions) | $101.94 (Wednesday-Thursday session high) |
| $97.92 (8 September settle, prior breakout base) | $104.00 (next psychological step) |
| $95.50 (WTI parity zone / early-September breakout) | $121.68 (Oman futures print, extreme-tightness marker) |
What it means for Australia
Australian motorists are already absorbing the shock. Since the conflict began on 23 February 2026, Australian petrol prices are up 28.7% and diesel is up 42.5%, according to GlobalPetrolPrices data — with diesel's larger increase reflecting exactly the distillate tightness Argus describes. ANZ's Daniel Hynes notes that "tit-for-tat attacks mean Persian Gulf oil flows are likely to remain disrupted for the foreseeable future", which keeps fuel costs a live input for Australian inflation and, by extension, for RBA policy.
For traders, the setup into the OPEC report is a market priced for scarcity but trading below its own upside tail: as long as crude holds $100, dips are likely to be bought; a sustained break below the $97.92 breakout base would signal that the demand-destruction side of the ledger is winning.
Related reads: for how the oil shock is feeding into rate expectations and the dollar, see US dollar clings to nine-week lows as Brent nears $100; for the inflation read-through into gold, see Gold rebounds past $4,400 as rate-hike odds cool.
Read more
Before making any trading decisions, it is important to equip yourself with sufficient fundamental knowledge, have a comprehensive understanding of market trends, be aware of risks and hidden costs, carefully consider investment targets, level of experience, risk appetite, and seek professional advice if necessary.
Furthermore, the content of this article is solely the author's personal opinion and does not necessarily constitute investment advice. The content of this article is for reference purposes only, and readers should not use this article as a basis for any investment decisions.
Investors should not rely on this information as a substitute for independent judgment or make decisions solely based on this information. It does not constitute any trading activity and does not guarantee any profits in trading.
If you have any inquiries regarding the data, information, or content related to Mitrade in this article, please contact us via email: insights@mitrade.com. The Mitrade team will carefully review the content to continue improving the quality of the article.


